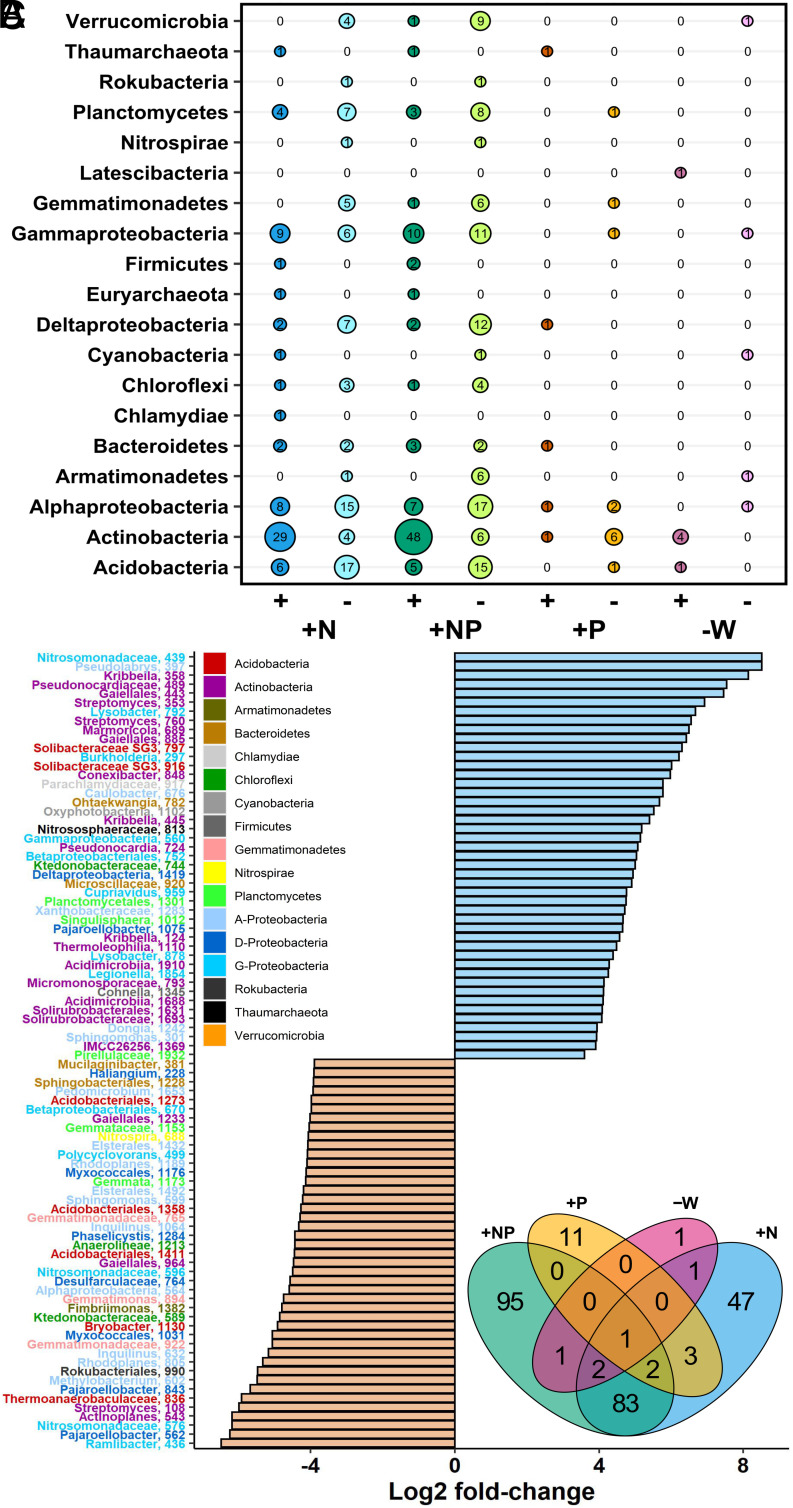
Fig. 2.
Influence of nutrient and water limitation on switchgrass rhizosphere microbial community structure assessed by DESeq2 analysis. (A) Number of positively (+) and negatively (−) responsive ASVs in nutrient-amended and water-limited treatments (+N, +NP, +P, −W) as compared to control soils, arranged by phyla (bubble size reflects the number of responsive ASVs). Empty cells indicate no responsive ASVs from that phylum. (B) The top-50 ASVs that increased (+Log2 fold-change) versus decreased in prevalence (−Log2 fold-change) in response to the +N treatment. ASVs are presented at the highest available taxonomic resolution and are colored by class for Proteobacteria and by phylum for all other phyla. (C) Number of unique and shared ASVs that changed in prevalence in response to each treatment relative to controls.

