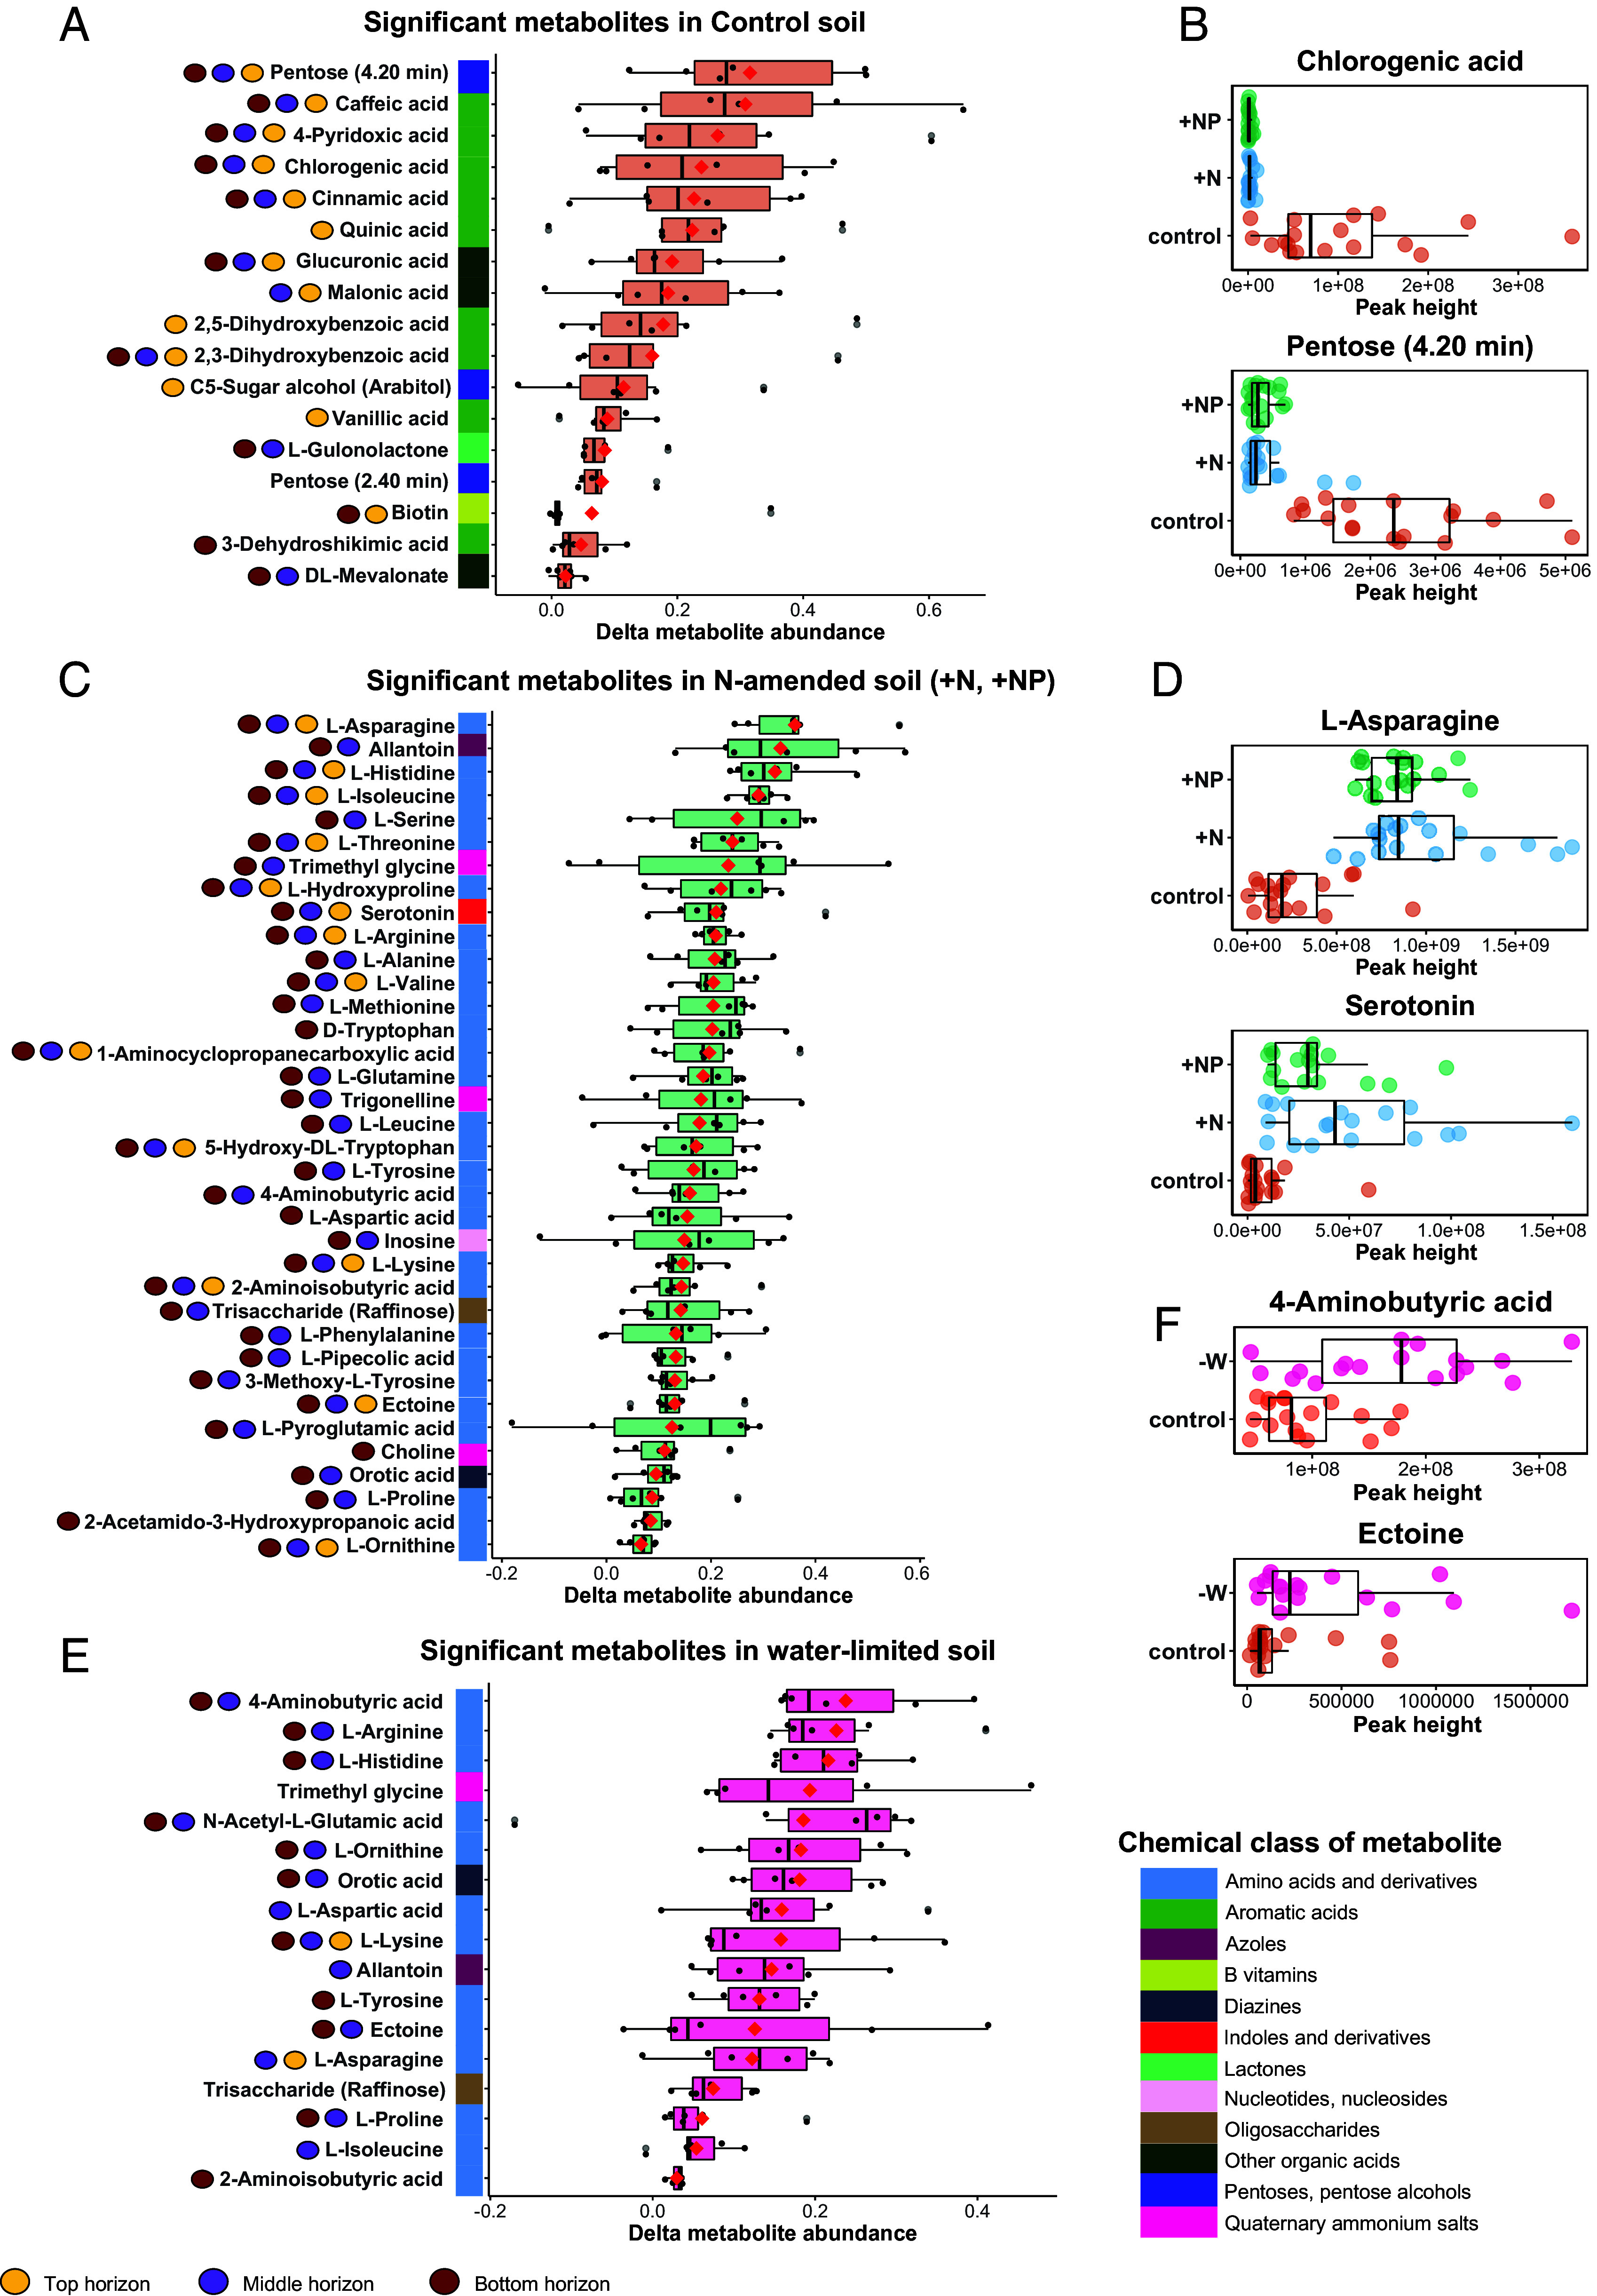
Fig. 3.

Significant changes in switchgrass rhizosphere metabolite profiles in response to five nutrient and water stress treatments (n replicates = 6), assessed by PERMANOVA (P < 0.05; Dataset S4 for details). (A) Metabolites significantly enriched (P < 0.05) in a nutrient-depleted marginal soil (control) compared to treatments where N was added (+N; +NP). Y-axis circles next to each metabolite represent the soil horizons where the metabolite had a significantly different abundance. Unresolvable metabolites are indicated by parentheses. (B) Abundance of an example metabolite enriched in nutrient-depleted soil across all three horizons. (C) Metabolites that increased (P < 0.05) in abundance in response to N addition (+N, +NP) compared to the control soil. (D) Abundance of an example metabolite enriched in N-replete soil. (E) Metabolites that increased in abundance (P < 0.05) in response to water limitation (−W) compared to the control soil. (F) Abundance of an example metabolite enriched in the water-limited treatment. The red diamond inside each box denotes the mean and the horizontal line denotes the median. Points reflect a single metabolite per sample, the outer boxes indicate the first, second, and third data quartiles, and whiskers indicate the range of the points excluding outliers.
