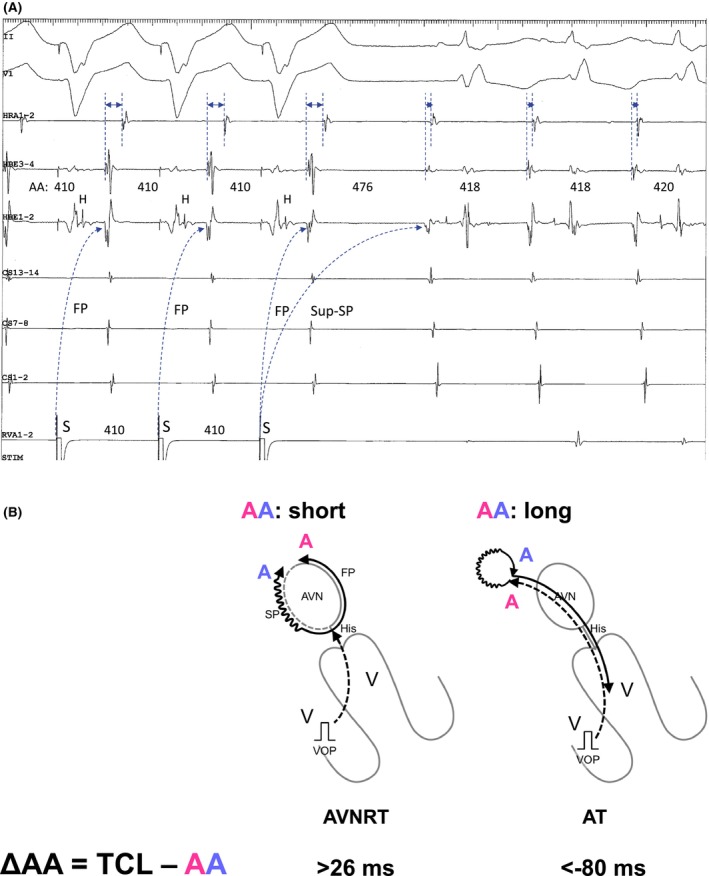
FIGURE 3.

(A) Intracardiac electrograms of a double atrial response utilizing both fast and superior slow pathways in fast‐slow AVNRT via a superior (Sup)‐slow pathway. (B) Schematic diagrams depicting the ΔAA intervals in AVNRT and AT. Abbreviations are as in Figure 2.
