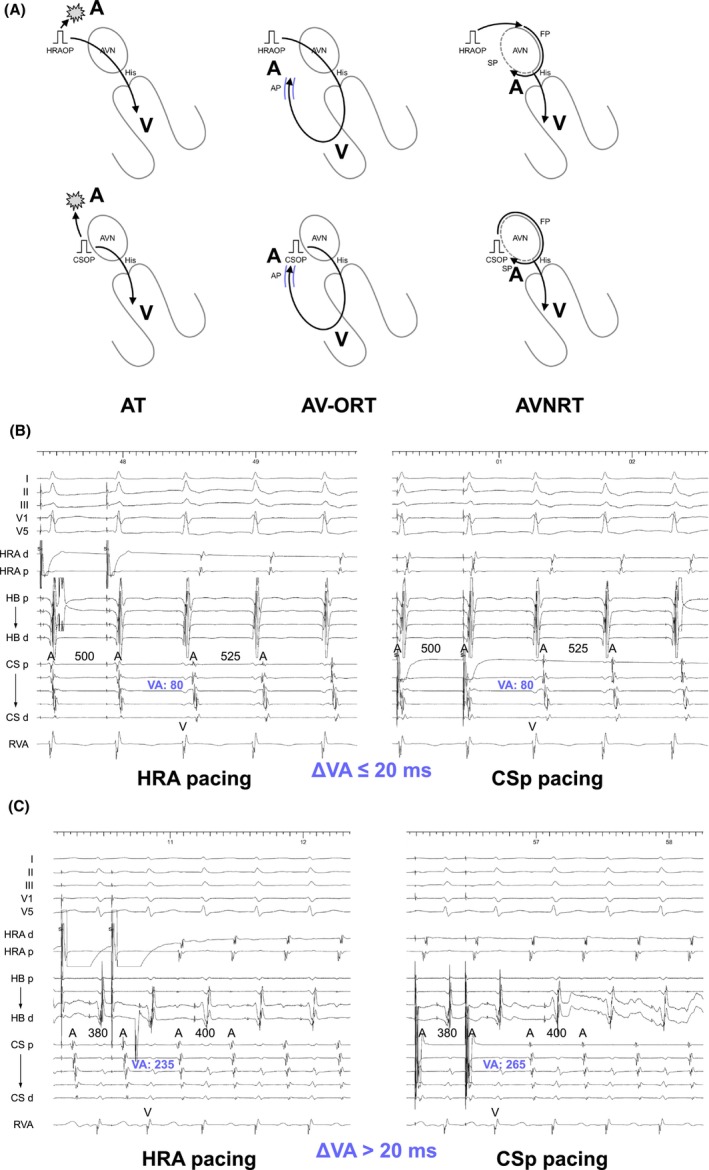
FIGURE 4.

(A) Schematic diagrams depicting the ΔVA interval after atrial overdrive pacing (OP), according to the mechanisms of tachycardia, along with intracardiac electrograms recorded during differential AOP from the high right atrium (left) and proximal coronary sinus (right) in (B) slow‐slow AVNRT and (C) AT. Abbreviations are as in Figure 2.
