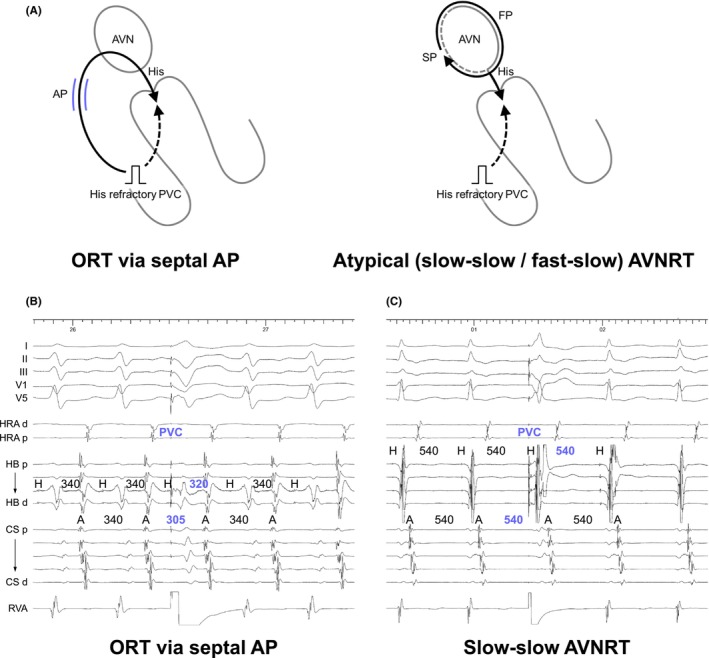
FIGURE 8.

(A) Schematic diagrams depicting a scanned single PVC delivered during His‐refractoriness, according to the mechanisms of tachycardia, along with intracardiac electrograms in (B) ORT via a septal AP and (C) slow‐slow AVNRT. Abbreviations are as in Figure 2.
