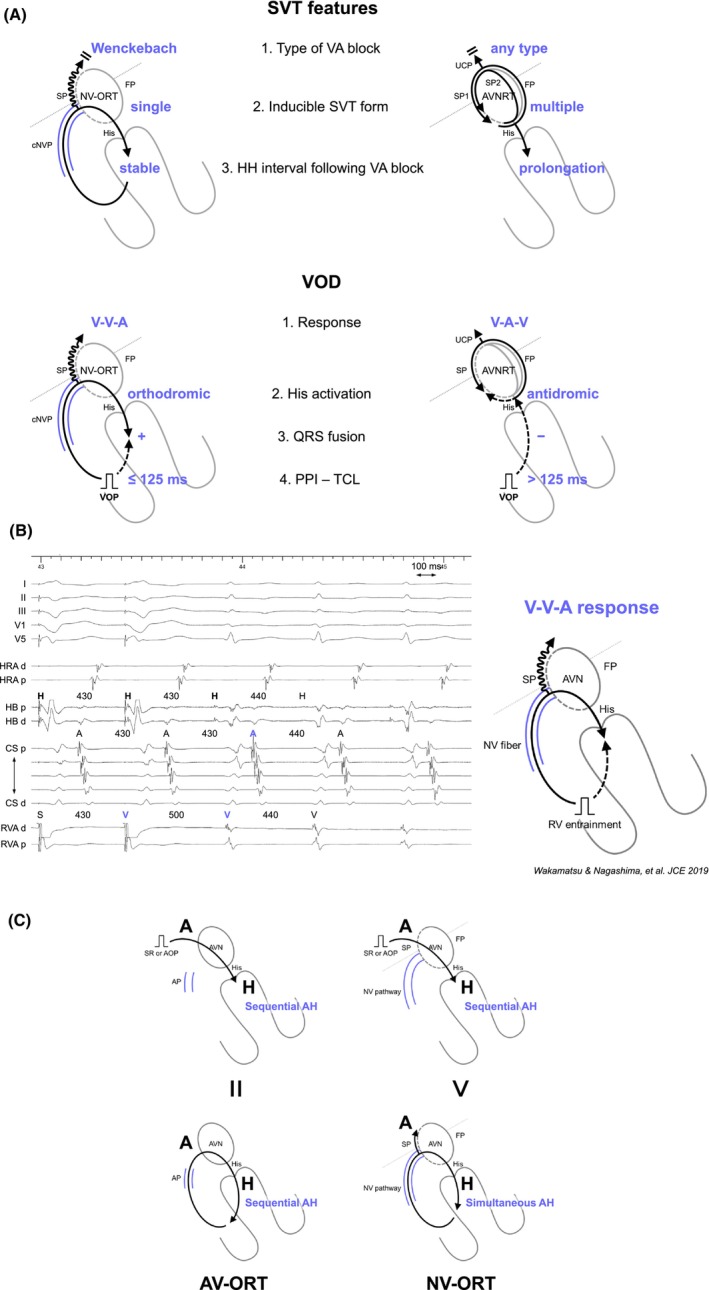
FIGURE 11.

(A) Schematic diagrams showing the tachycardia features and responses during ventricular overdrive pacing (VOD) for the ORT via a concealed nodoventricular pathway (cNVP) and AVNRT with an upper common pathway (UCP), along with intracardiac electrograms in (B) NV‐ORT. (C) Schematic diagrams depicting AH interval during sinus rhythm (SR) or atrial overdrive pacing (AOP, upper panel), and tachycardia in ORT via an atrioventricular accessory pathway (AP) and via cNVP (lower panel). Abbreviations are as in Figure 2.
