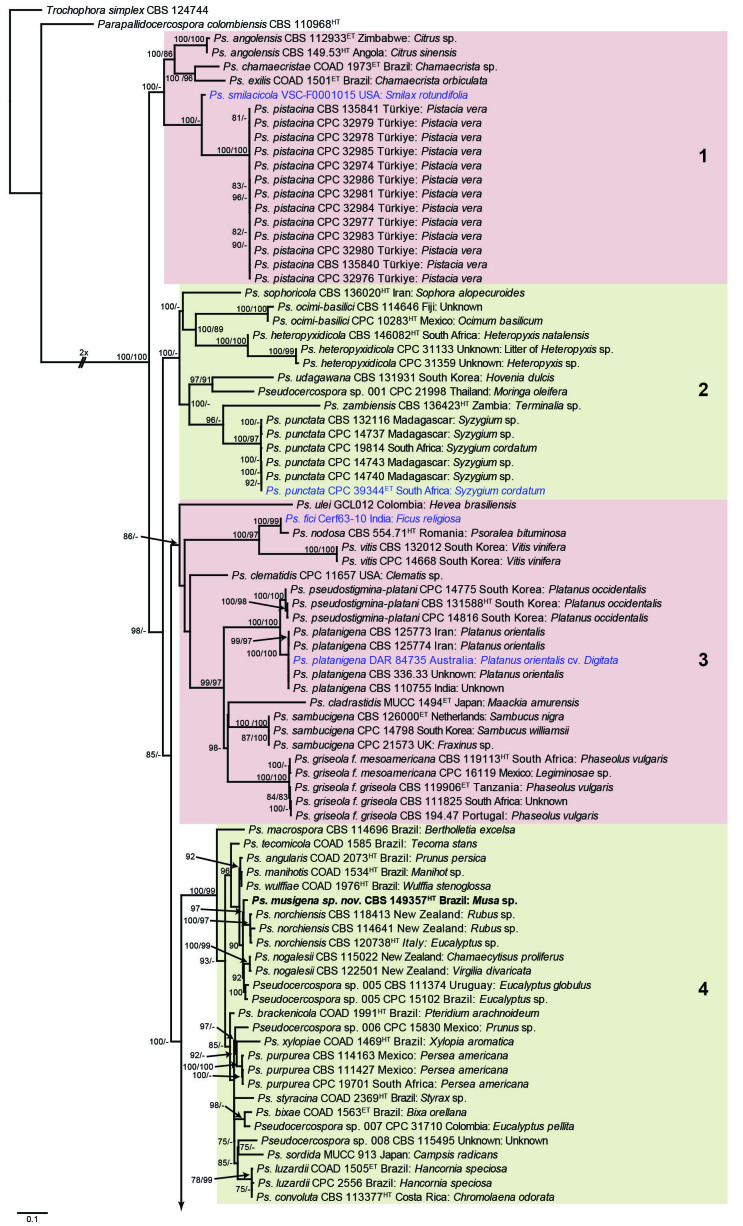
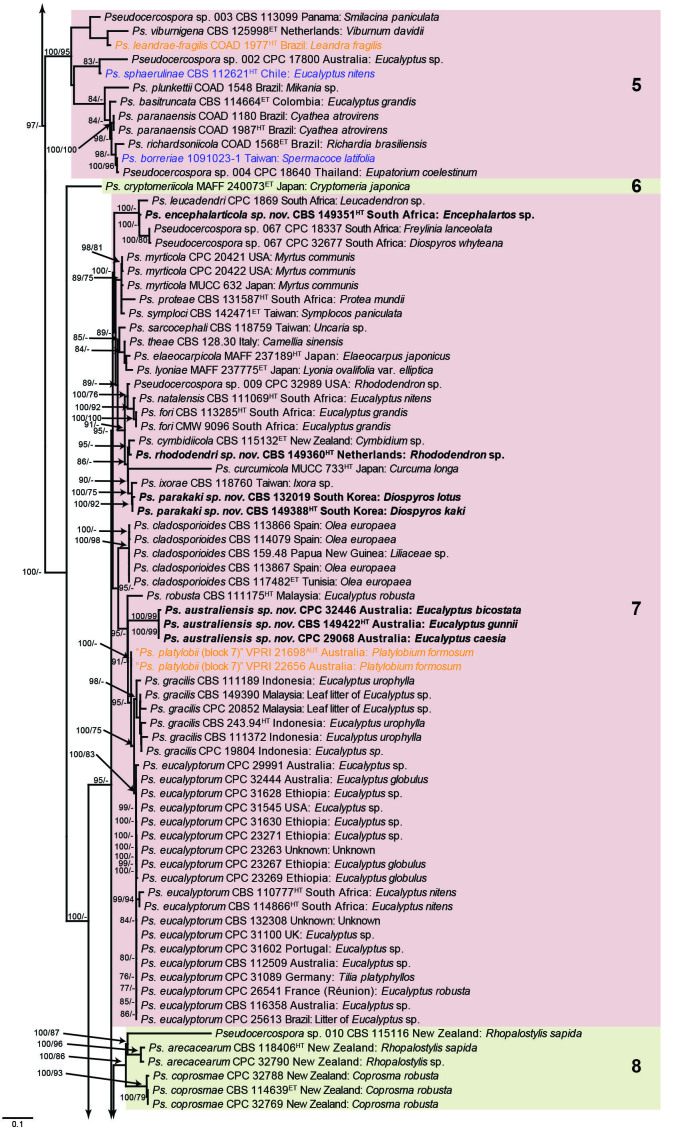
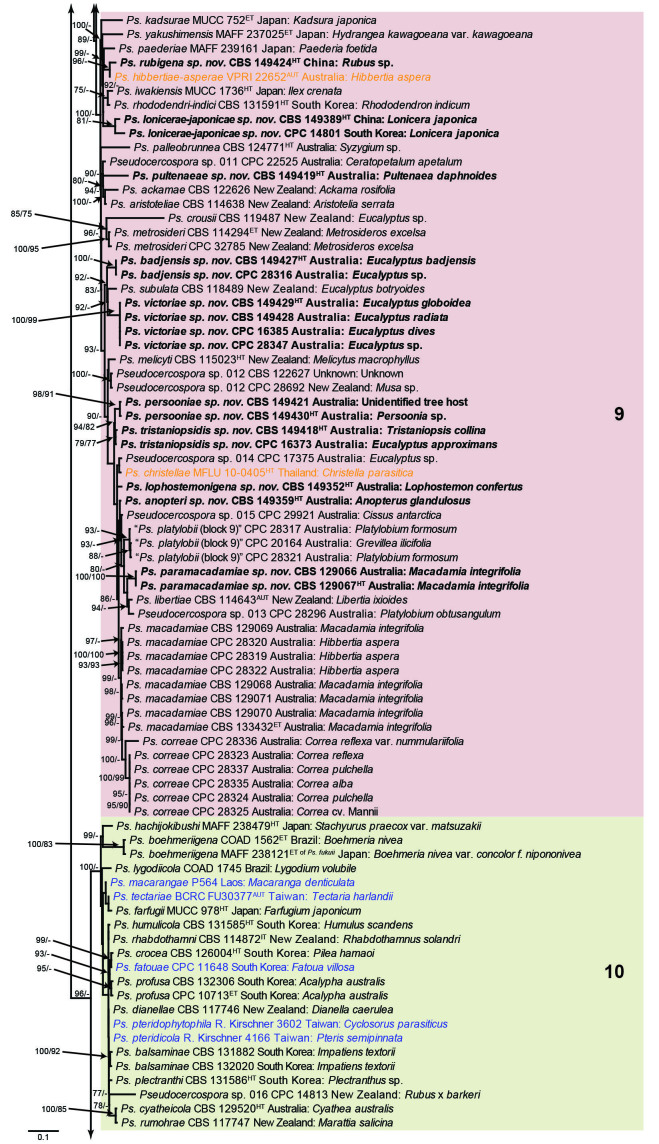
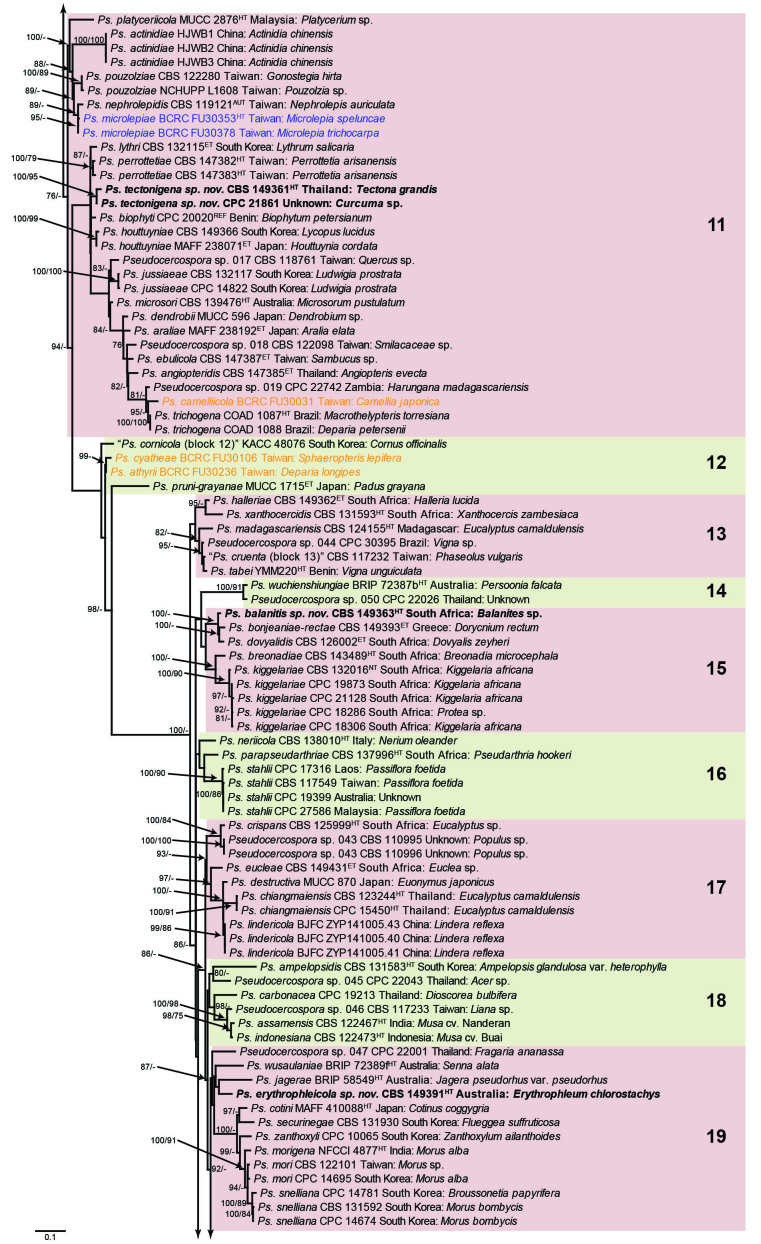
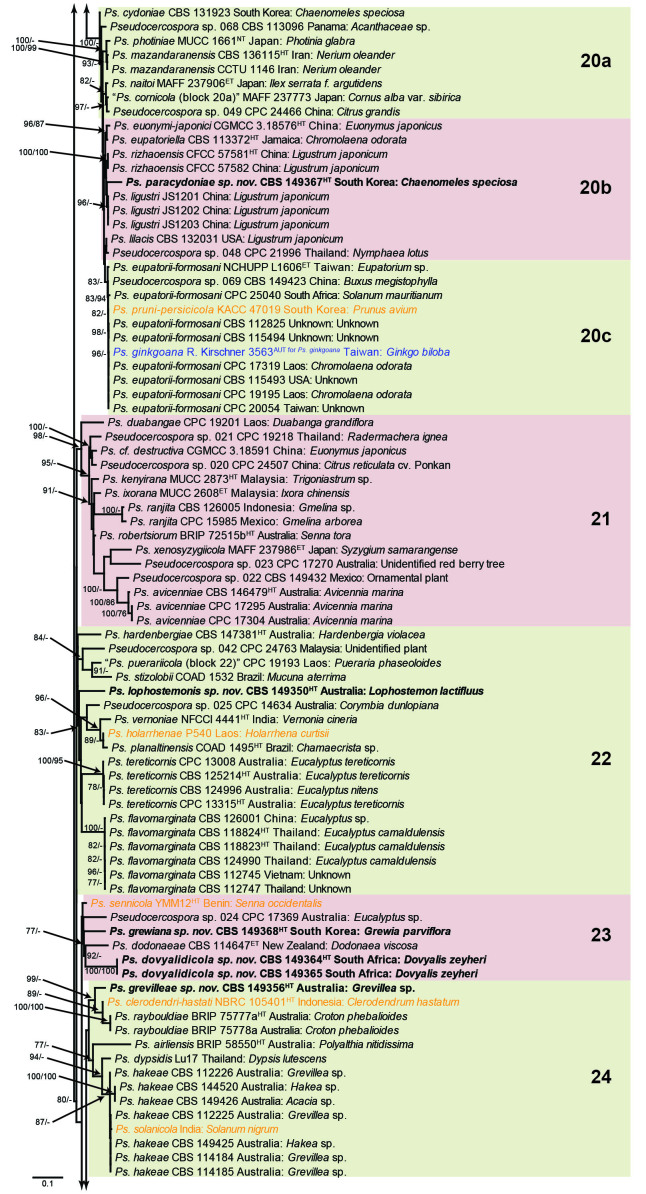
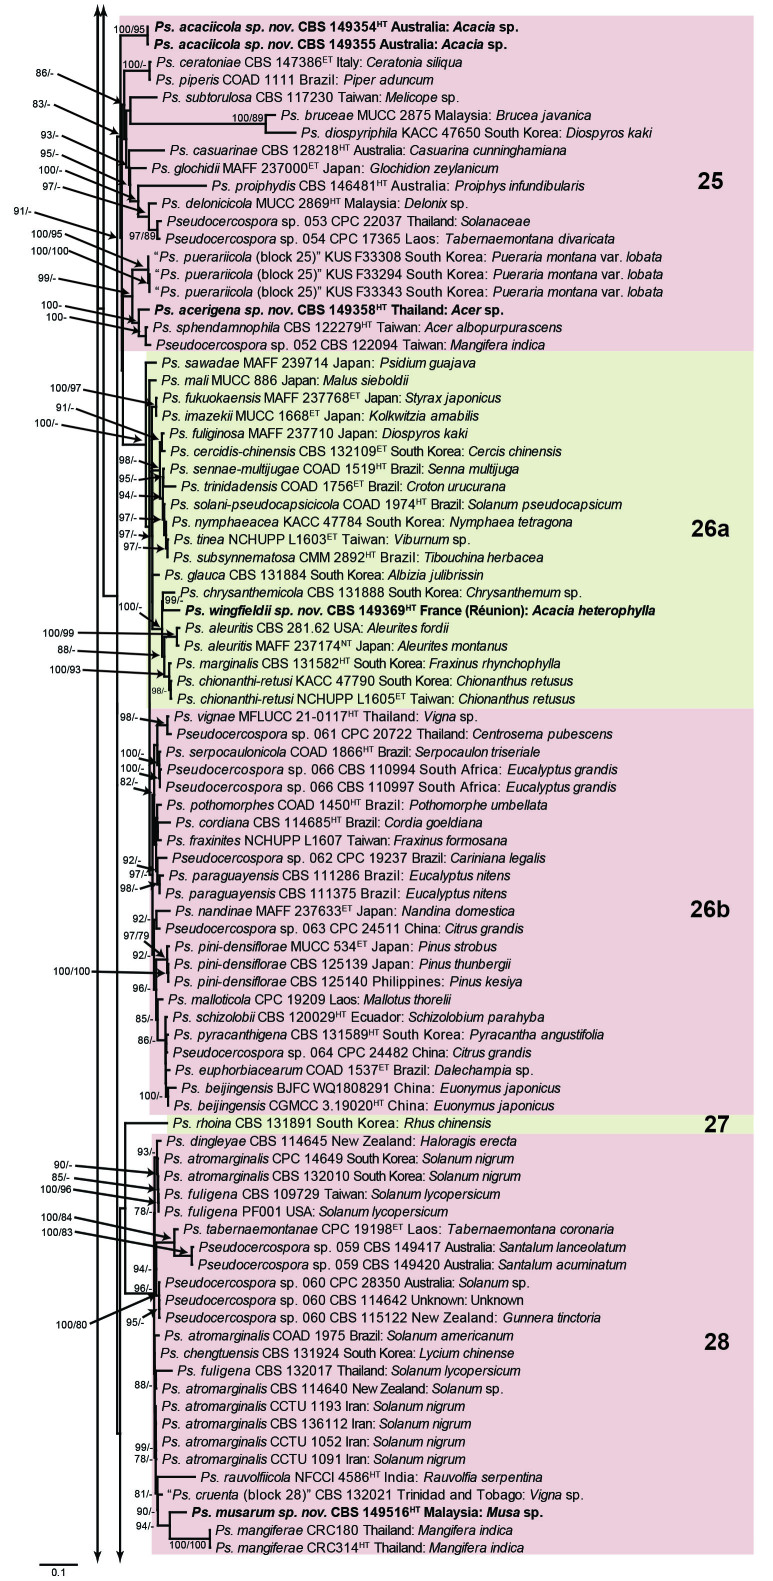
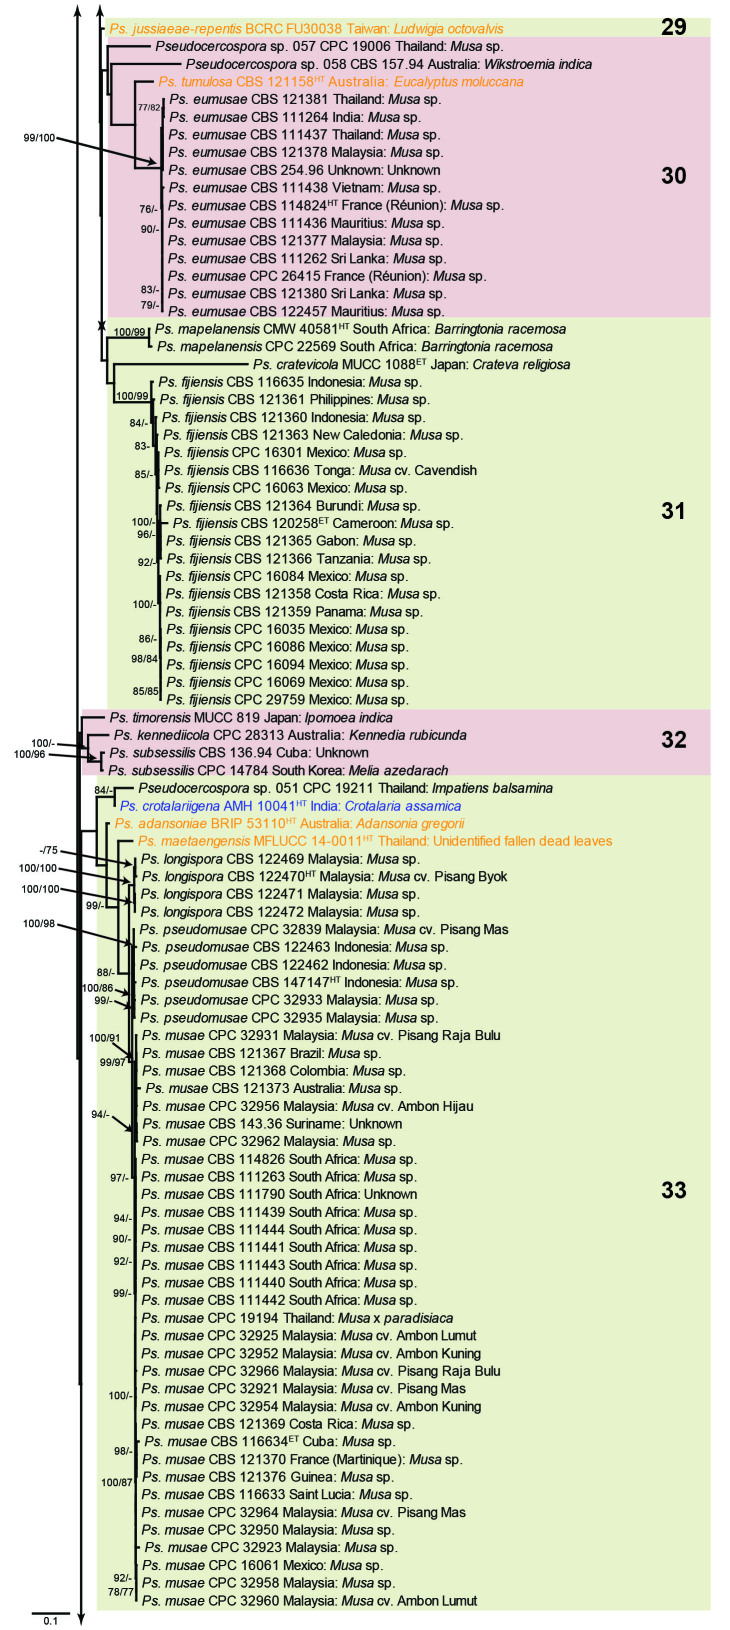
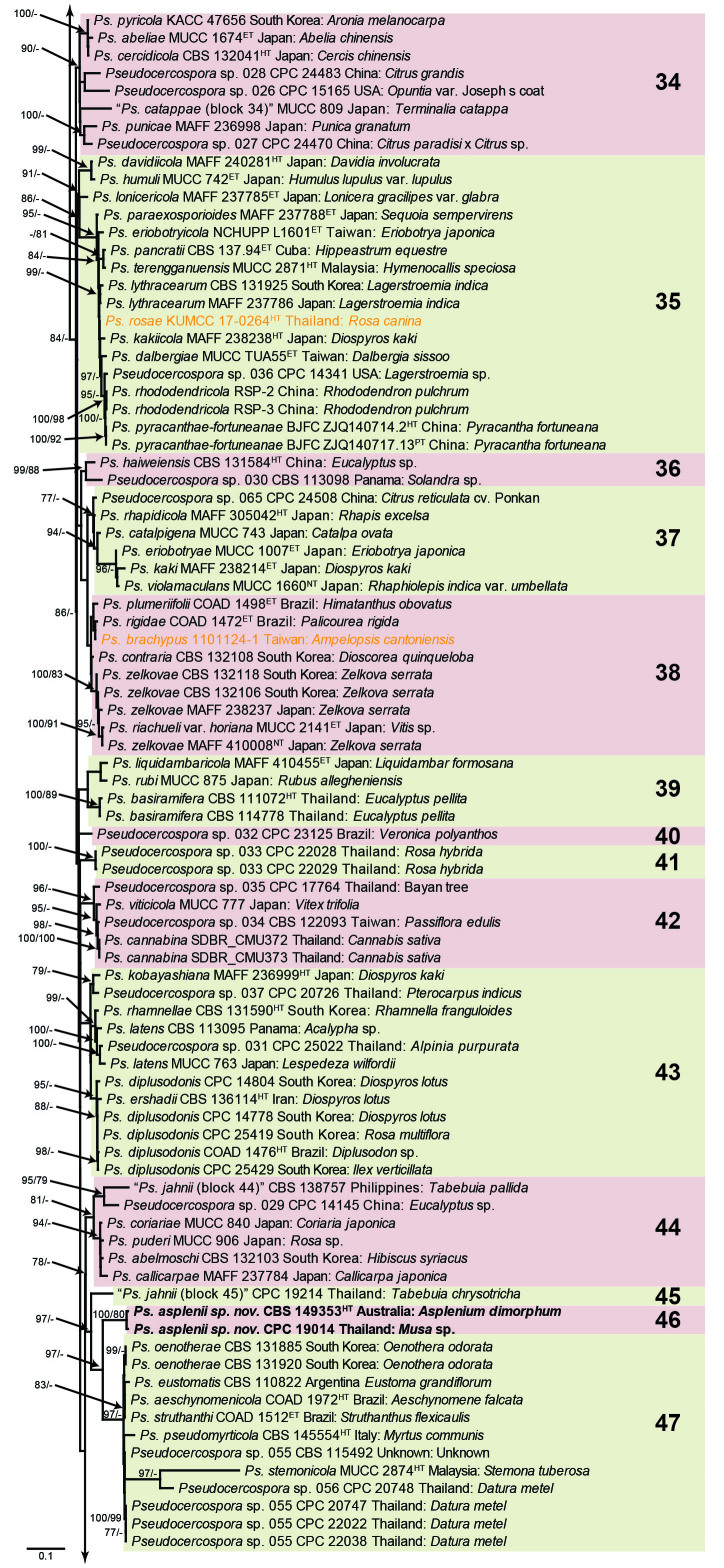
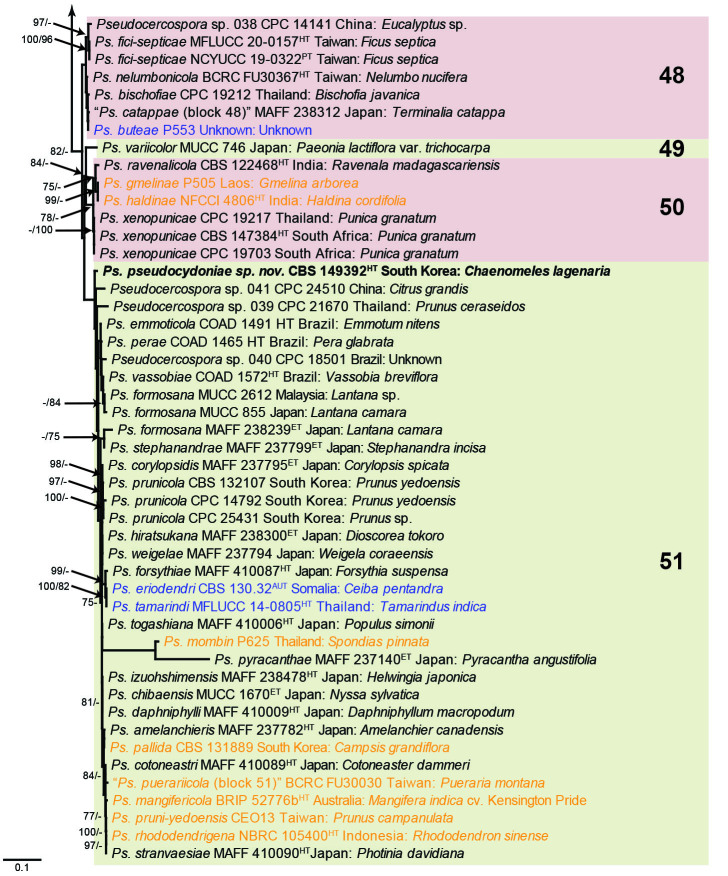
Fig. 1.
Consensus phylogram (50 % majority rule) obtained from the maximum likelihood analysis with IQ-TREE v. 2.1.3 of the concatenated nucleotide alignment. Bootstrap support values (> 74 %) from 1 000 non-parametric bootstrap replicates are shown at the nodes, followed by RAxML 1 000 replicate bootstrap support values (> 74 %). Culture collection or voucher numbers are followed by the country and host information where available. Sequences derived from material with a type status are indicated with a superscript HT (from (ex-)type), IT (from (ex-)isotype), PT (from (ex-)paratype), NT (from (ex-)neotype, AUT (from authentic), REF (from reference) and ET (from (ex-)epitype). Strains in dark blue font represent strains with only an ITS sequence in the dataset but with no conflict in their positions between the IQ-TREE and RAxML analyses, whereas an orange font indicates such a strain with a conflict in its position between the two analyses. Numbered coloured blocks are provided to facilitate referencing to the position of a species in the phylogenetic tree. Taxa for which it was not possible to assign the correct name due to lack of type material are indicated together with their block number between parentheses in the phylogenetic tree, Suppl. Tables S1 and S3 and the Taxonomy section. Novel species described in this study are highlighted with bold font. The tree was rooted to Trochophora simplex with Parapallidocercospora colombiensis as internal distant genus. The scale bar indicates the expected number of changes per site.

