
Figure 4.
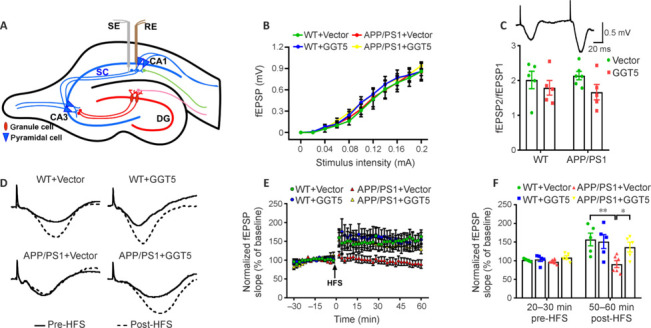
GGT5 overexpression in cerebrovascular endothelial cells enhances synaptic plasticity in the hippocampus of APP/PS1 mice.
(A) The location of the SE and RE in the hippocampus. Created with Adobe Illustrator CS5. (B) I–O curves recorded in the hippocampal CA1 region of mice in each group. (C) Histogram showing the PPF ratios in each group, and a representative fEPSP traces induced by PPF. (D) Sample fEPSP traces before HFS (solid line) and 60 minutes after HFS (dotted line) for each group. (E) Graph displaying the fEPSP slope in the hippocampal CA1 region before and after HFS for mice from each group. (F) Histogram showing the average fEPSP slope before HFS (20–30 minutes) and after HFS (50–60 minutes) in each group. Data are expressed as mean ± SEM (n = 5–6 per group). *P < 0.05, **P < 0.01 (one-way analysis of variance followed by the least significant difference test). CA: Cornu ammonis; DG: dentate gyrus; fEPSPs: field excitatory postsynaptic potentials; GGT5: gamma-glutamyltransferase 5; HFS: high frequency stimulation; I–O: input‒output; PPF: paired-pulse facilitation; RE: recording electrode; SE: stimulation electrode; WT: wide type.