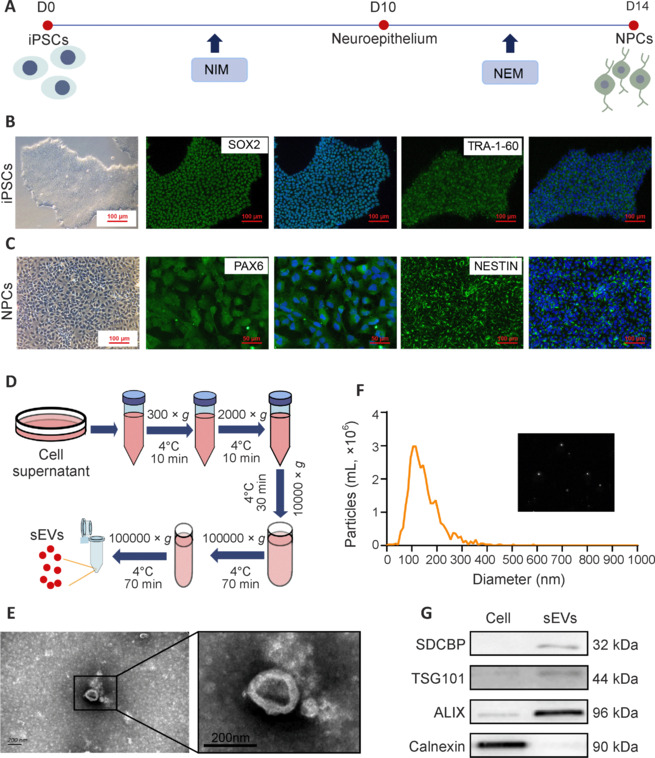
Figure 1.

Isolation and characterization of sEVs from hiPSCs and hiPSC-NPCs.
(A) Schematic illustration of direct NPC differentiation of hiPSCs. (B, C) Representative morphology and immunostaining of hiPSCs and hiPSC-NPCs. hiPSCs showed a typical clone morphology with SOX2 and TRA-1-60 expression. hiPSC-NPCs showed a typical epithelium morphology with PAX6 and NESTIN expression. Scale bars: 100 μm. (D) Schematic of sEV isolation protocol. (E) Representative TEM images of NPC-sEVs showed a typical cup-like structure. Scale bar: 200 nm. (F) Size distribution of NPC-sEVs. The inset is a snapshot image of video tracking. (G) Western blot results for positive (SDCBP, TSG101, and ALIX) and negative (calnexin) biomarkers of NPC-sEVs and parental cells. ALIX: Apoptosis-linked gene 2-interacting protein X; hiPSC: human induced pluripotent stem cell; NEM: neural expansion medium; NIM: neural induction medium; NPC: neuronal progenitor cell; PAX6: paired box 6; SDCBP: syndecan binding protein; sEV: small extracellular vesicle; SOX2: SRY-box transcription factor 2; TRA-1-60: tumor-related antigen-1-60; TSG101: tumor susceptibility 101.
