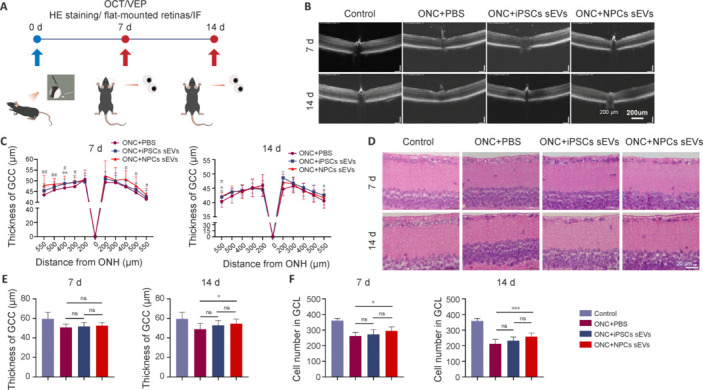
Figure 2.

Neuroprotective effects of sEVs from hiPSCs and hiPSC-NPCs by OCT and HE staining.
(A) Schematic of animal experiments. (B) Representative OCT images of mice at 7 and 14 days post-ONC. Thickness of the retina decreased with time. Scale bar: 200 μm. (C) OCT statistical results of mean thickness of the GCC layer (n = 16). *P < 0.05, **P < 0.01, hiPSC-sEVs group vs. PBS group; #P < 0.05, ##P < 0.01, NPC-sEVs group vs. PBS group. (D) Representative image of the GCC layer from mice at 7 and 14 days post-ONC. Similar to the results obtained by OCT, thickness of the retina decreased with time. Scale bars: 20 μm. (E) Statistical results of mean thickness of the GCC layer (n = 12). (F) Quantification of mean number of cells in the GCL (n = 12). *P < 0.05, ***P < 0.001. Data are expressed as mean ± SEM (C) or mean ± SD (E and F), and were analyzed by Student’s t-test (C) or one-way analysis of variance followed by Tukey’s post hoc test (E and F). GCC: Ganglion cell complex; GCL: ganglion cell layer; HE: hematoxylin-eosin; hiPSC: human induced pluripotent stem cell; IF: immunofluorescence; iPSC: induced pluripotent stem cell; NPC: neural progenitor cell; ns: not significant; OCT: optical coherence tomography; ONC: optic nerve crush; ONH: optic nerve head; PBS: phosphate buffer saline; sEV: small extracellular vesicle; VEP: visual evoked potential.
