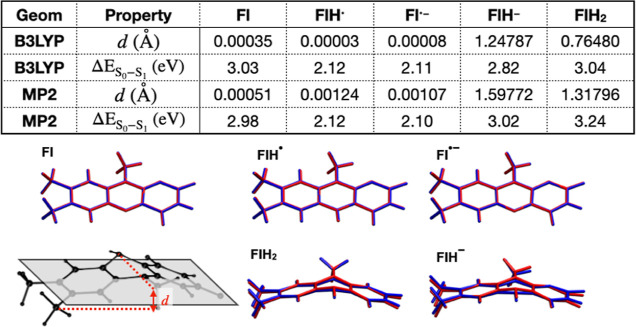
Figure 3.
Comparison of geometries and TD-B3LYP/cc-pVTZ excitation energies of flavin in five different redox states optimized with B3LYP and MP2. The schematic at the bottom left panel indicates the definition of the parameter d, which is difference in the maximum and minimum positions of heavy atoms along the z axis when the molecules are aligned as closely as possible along the x–y plane. The other five panels show the overlay of the structure for each redox state optimized at the B3LYP (blue) and MP2 (red) levels of theory.

