Figure 8.

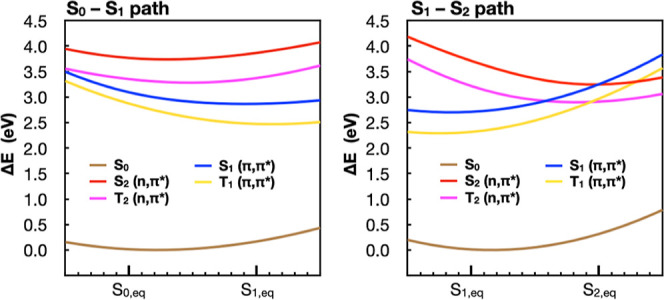
3-Root MS-CAPT2(IPEA = 0.25)[14,12]/ANO-L-VDZP S0 (brown), S1 (blue), S2 (red), T1 (yellow) and T2 (magenta) energies along the S0–S1 path (left) and the S1–S2 path (right).

3-Root MS-CAPT2(IPEA = 0.25)[14,12]/ANO-L-VDZP S0 (brown), S1 (blue), S2 (red), T1 (yellow) and T2 (magenta) energies along the S0–S1 path (left) and the S1–S2 path (right).