Fig. 5.
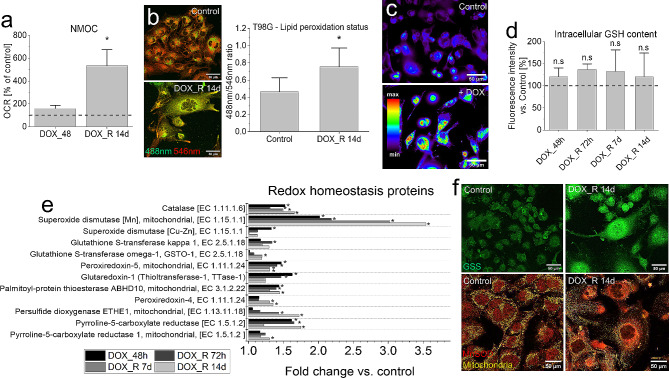
ROS scavengers in DOX-induced PGCs. (a) Seahorse XFp analyses of the short- and long-term DOX effects on the non-mitochondrial oxygen consumption (NMOC) in T98G cells. (b,c) Lipid peroxidation status (analyzed with Image iT™ Lipid Peroxidation kit, (b) and ROS levels (c) estimated 14 days after DOX removal and 6 h after DOX application, respectively. (d) Intracellular GSH content estimated with the fluorescence microscopy-assisted (ThiolTracker™ Violet assay; Spectrum LUT mask) at the indicated time-points. (e) The cluster of ROS managing proteins revealed by LC-MS/MS proteomic analyses (cf. Fig. S12 for their STRING-generated interactome). (f) Localization of MnSOD and glutathione synthetase (GSS) in DOX-induced PGCs. Scale bars = 50 μm. Statistical significance was calculated with t-student test (a,b,d) or ANOVA permutation based FDR < 0.05 and post hoc Tukey’s test (e), *p < 0.05 vs. control. Data representative for 4 independent biological replicates (random microphotographs; b,c,f). Error bars represent SD. Note low levels of oxidative stress in PGCs accompanied by the mobilization of mitochondrial and cytoplasmic ROS scavenging systems

