Fig. 1.
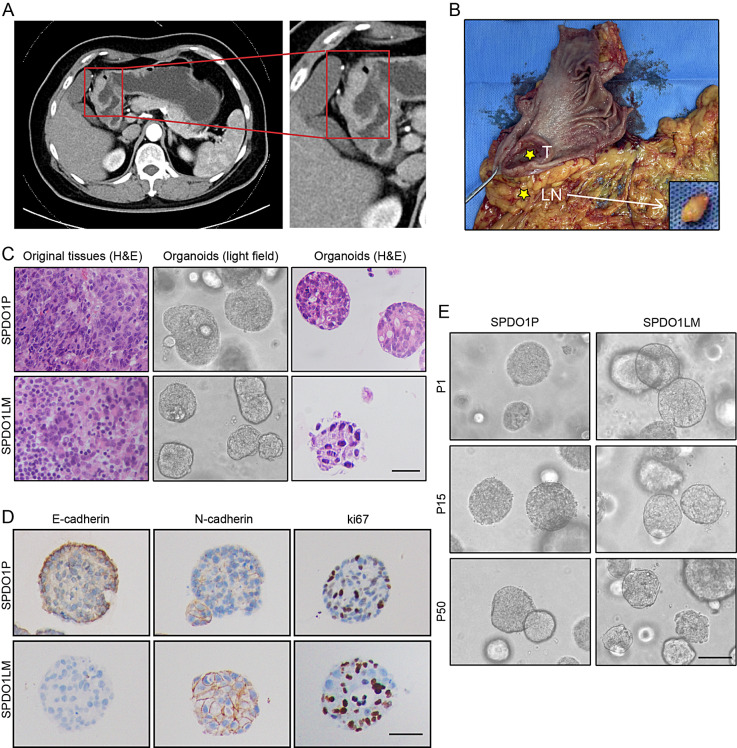
Clinicopathological characteristics of organoid lines (A) A thickened gastric antrum wall is shown by CT scanning. The red box marks the enlarged image. (B) An ulcerated mass is observed at the antrum in the gastrectomy sample with the enlarged lymph node near the right gastroepiploic artery (T, primary tumor; LN, lymph node). (C) From left to right, histology of poorly-differentiated adenocarcinoma of original tissues by H&E staining, organoid morphology by light- field observation, and organoid morphology by H&E staining. The histology is compatible with poorly-differentiated adenocarcinoma with irregular lumens. The upper panel indicates SPDO1P and the lower panel indicates SPDO1LM. Scale bar, 100 μm. (D) Immunohistochemical staining of E-cadherin, N-cadherin, and Ki67 for SPDO1P and SPDO1LM. Scale bar, 80 μm. (E) SPDO1P and SPDO1LM maintain cell vitality in continuous culture in vitro. Both organoid lines expanded for over 50 generations. Note: P1 = passage 1, P15 = passage 15, and P50 = passage 50. Scale bar, 100 μm

