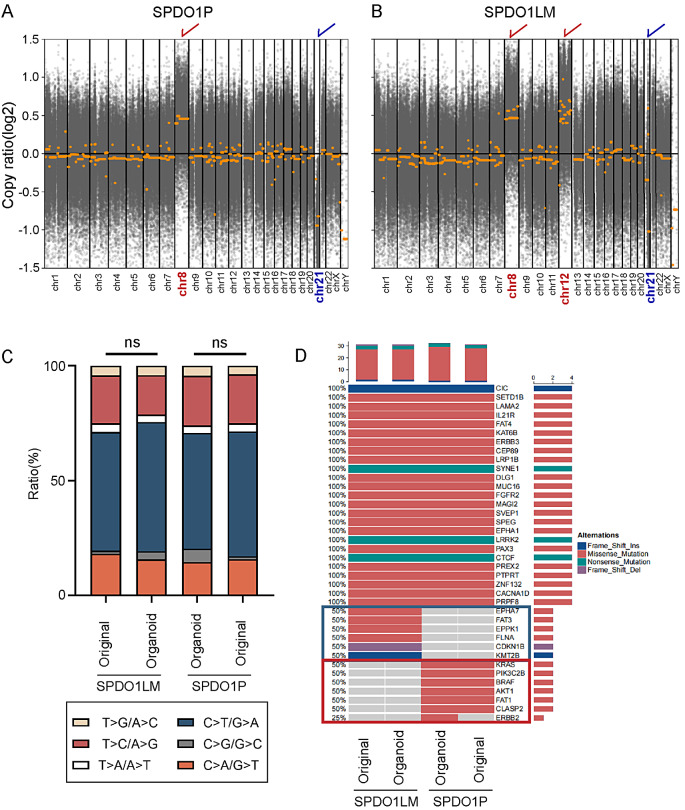
Fig. 4.
Genetic features of SPDO1P and SPDO1LM by whole-exome sequencing. (A) By CNV analysis, the SPDO1P shows a chromosome 8 gain (marked by red) and chromosome 21 loss (marked by blue). (B) By CNV analysis, the SPDO1LM line shows a chromosome 8 gain (marked by red), chromosome 12 gain (marked by red), and chromosome 21 loss (marked by blue). Copy ratio > 0 indicats a gain; copy ratio < 0 indicates a loss. (C) The bar plot of SNP ratios in SPDO1P, SPDO1LM, and their matched original tissues. There is no significant difference in the ratio of SNPs between SPDO1P and its original tissue (nsP = 0.8832) or SPDO1LM and its original cancer tissue (nsP = 0.7003) by the Chi-square test. (D) By mutation analysis, 25 somatic driver mutations are shared in both SPDO1P and SPDO1LM lines, as well as their original cancer tissues. There are specific driver mutations in the SPDO1P line and the matched cancer tissue (red box) and SPDO1LM line and matched cancer tissue (blue box)

