Fig. 5.
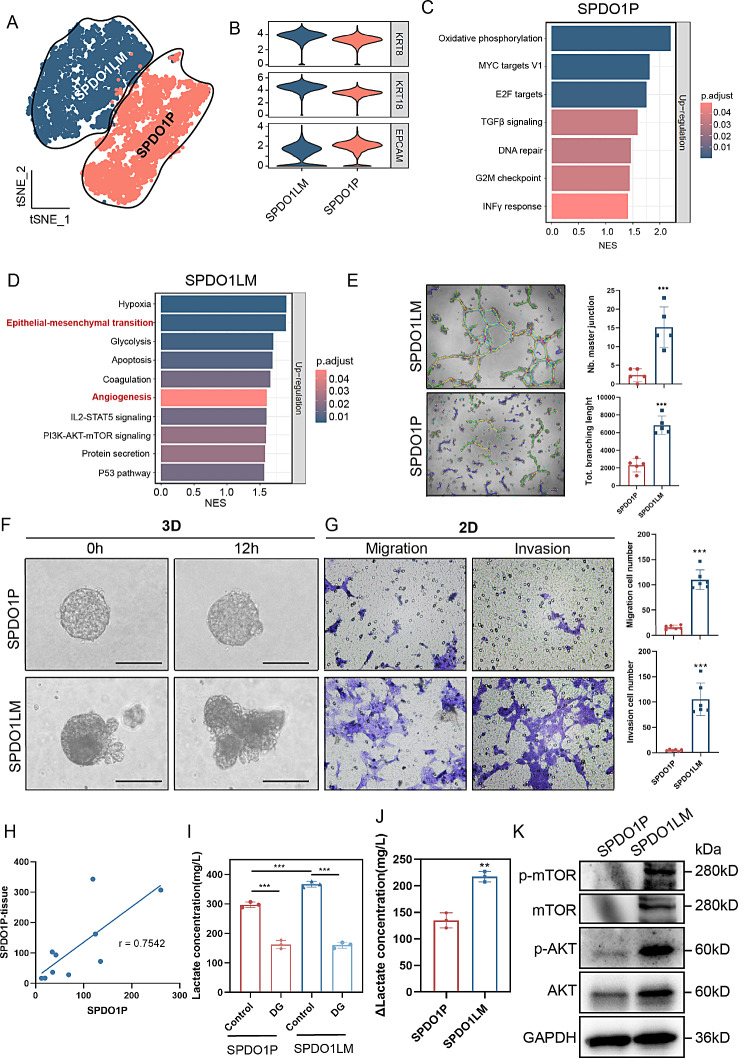
ScRNA-Seq and biological functions assays. (A) The tSNE plot of 10,578 cells from SPDO1P and SPDO1LM. The highly expressed genes of the SPDO1P and SPDO1LM organoid lines are separated into two clusters. (B) The violin plots show high expression of KRT8, KRT18, and EPCAM in SPDO1P and SPDO1LM. (C) The highly expressed gene set of SPDO1P is enriched in oxidative phosphorylation, MYC targets V1, and E2F target pathways. (D) The highly expressed gene set of SPDO1LM is enriched in hypoxia, EMT, glycolysis, apoptosis, coagulation, angiogenesis, IL2-STAT5 signaling, PI3K-AKT-mTOR signaling, protein secretion, and P53 pathways. (E) Images of the tubule formation analysis (light field). The supernatant of SPDO1LM shows stronger proangiogenic potential than that of SPDO1P with longer branch lengths and increased tubular junctions, n = 5. (F) Images of the organoid spheres in the 3D invasion assay of SPDO1P and SPDO1LM (light field). The SPDO1P line grows stably in a sphere structure, but the SPDO1LM line extends pseudopodia around the spheres. (G) Images of migration and invasion cells. The SPDO1LM line shows more migrated cells than the SPDO1P line after 72 h of incubation and more invading cells than SPDO1P after line for 96 h. n = 6. (H) The correlation analysis shows that the gene expression levels of the top 10 genes in the oxidative phosphorylation pathway of SPDO1P and the original tissue are consistent (r = 0.7542). (I) The lactate concentrations of both organoids significantly declined upon 2-deoxy-D-glucose (DG, 1 mM, 72 h) treatment. (J) The Δlactate concentration (lactate concentration of control group - lactate concentration of DG- treated group) is different between the two organoids. (K) According to western blot analysis, the protein expression levels of p-mTOR, mTOR, p-AKT, and AKT in the SPDO1LM line are higher than those of the SPDO1P line. *P < 0.05, **P < 0.01, ***P < 0.001

