Fig. 6.
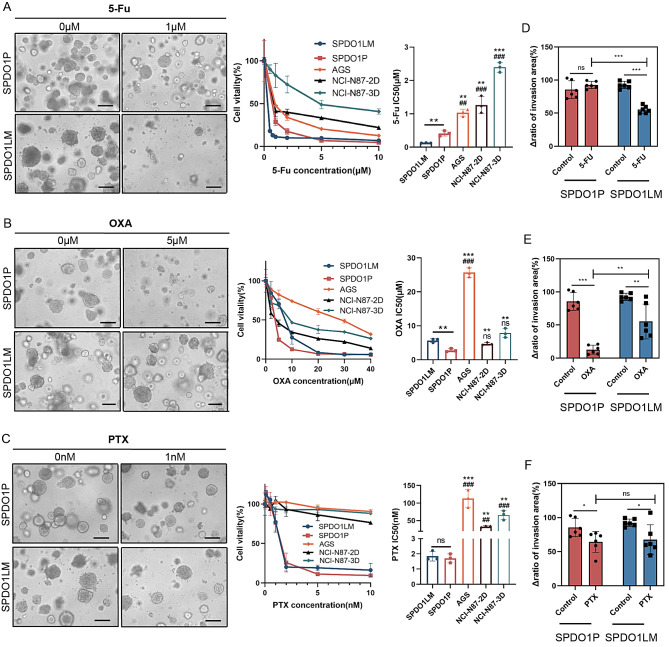
Drug sensitivity of SPDO1P and SPDO1LM lines and its effect on 3D cell invasion. (A) Left: The morphological changes of SPDO1P (upper) and SPDO1LM (lower) upon 5-Fu treatment. Middle: Cell vitality analysis of organoids compared to cancer cell lines AGS, NCI-N87-2D, and NCI-N87-3D spheroids upon 5-Fu treatment. Right: The bar chart shows IC50 values of organoids and cancer cell lines AGS, NCI-N87-2D, and NCI-N87-3D spheroids. (B) Left: The morphological changes of SPDO1P (upper) and SPDO1LM (lower) upon OXA treatment. Middle: Cell vitality analysis of organoids compared to cancer cell lines AGS, NCI-N87-2D, and NCI-N87-3D spheroids upon OXA treatment. Right: The bar chart shows IC50 values of organoids and cancer cell lines AGS, NCI-N87-2D, and NCI-N87-3D spheroids upon OXA treatment. (C) Left: The morphological changes of SPDO1P (upper) and SPDO1LM (lower) upon PTX treatment. Middle: Cell vitality analysis of organoids compared to cancer cell lines AGS, NCI-N87-2D, and NCI-N87-3D spheroids upon PTX treatment. Right: The bar chart shows IC50 values of organoids and cancer cell lines AGS, NCI-N87-2D, and NCI-N87-3D spheroids upon PTX treatment. n = 3. Scale bar, 100 μm. (D) In 3D cell invasion assays, 5-Fu more significantly inhibits SPDO1LM invasion in SPDO1LM compared to SPDO1P. (E) OXA significantly inhibits SPDO1P invasion compared to SPDO1LM. (F) PTX inhibits both SPDO1P and SPDO1LM invasion compared to controls. nsP > 0.05, *P < 0.05, **P < 0.01, ***P < 0.001

