. 2024 Aug 8;24(18):4321–4332. doi: 10.1039/d4lc00269e

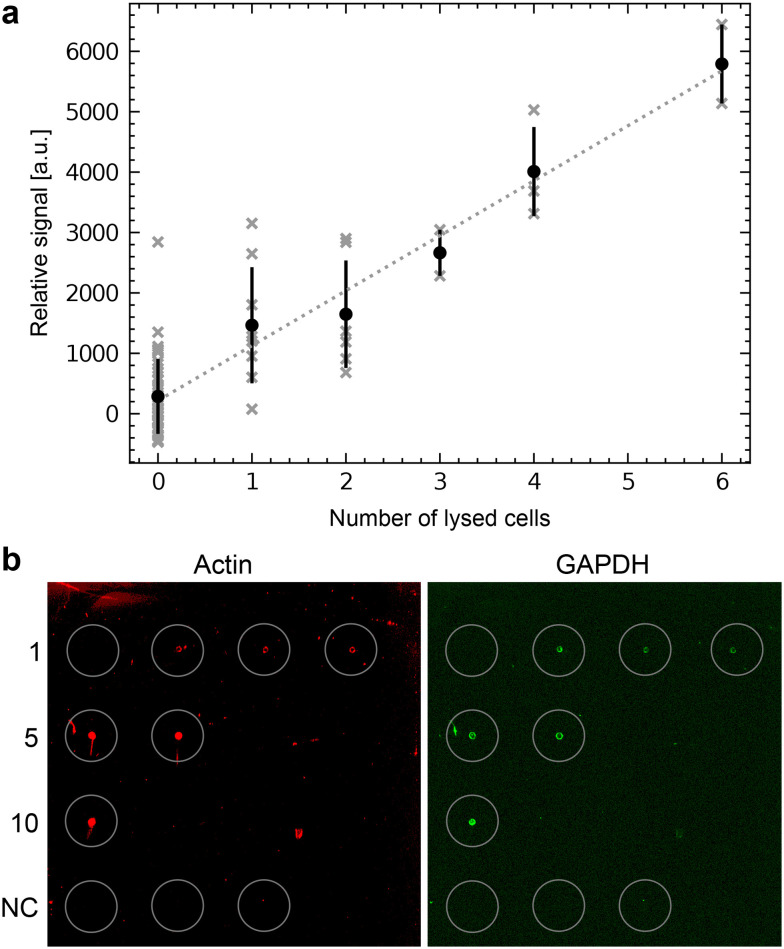
Fig. 6. Single-cell RPPA. a) One to six HEK cells were lysed, aspirated and dispensed as spots on an NC-pad on the carrier slide. The slide was scanned after incubation with an anti-actin antibody and a fluorescently labeled secondary antibody. The total fluorescence intensity was plotted against the number of lysed cells dispensed in each spot. The average intensities and the standard deviation are indicated in black to show the variation. The individual cells are shown in gray. A linear regression is shown as a dashed line. b) Single-cell RPPA dot-blot using an NHS-functionalized glass slide for covalent immobilization of the proteins. The left panel shows the detection of actin (in red), and the right panel of GAPDH (in green). Single cells were individually lysed and dispensed. This cycle was repeated for every spot for 1, 5, and 10 cells. Cumulated volumes of 3 nL, 15 nL or 30 nL of lysate were dispensed, depending on the number of lysed cells. The number of individually lysed cells per spot is indicated in the left column. The last row depicts the negative control (NC), where 10 nL, 20 nL or 30 nL of the buffer surrounding the cells were dispensed.

Fig. 6