
FIGURE 5. Interindividual variability in targeting the frontopolar cortexa.
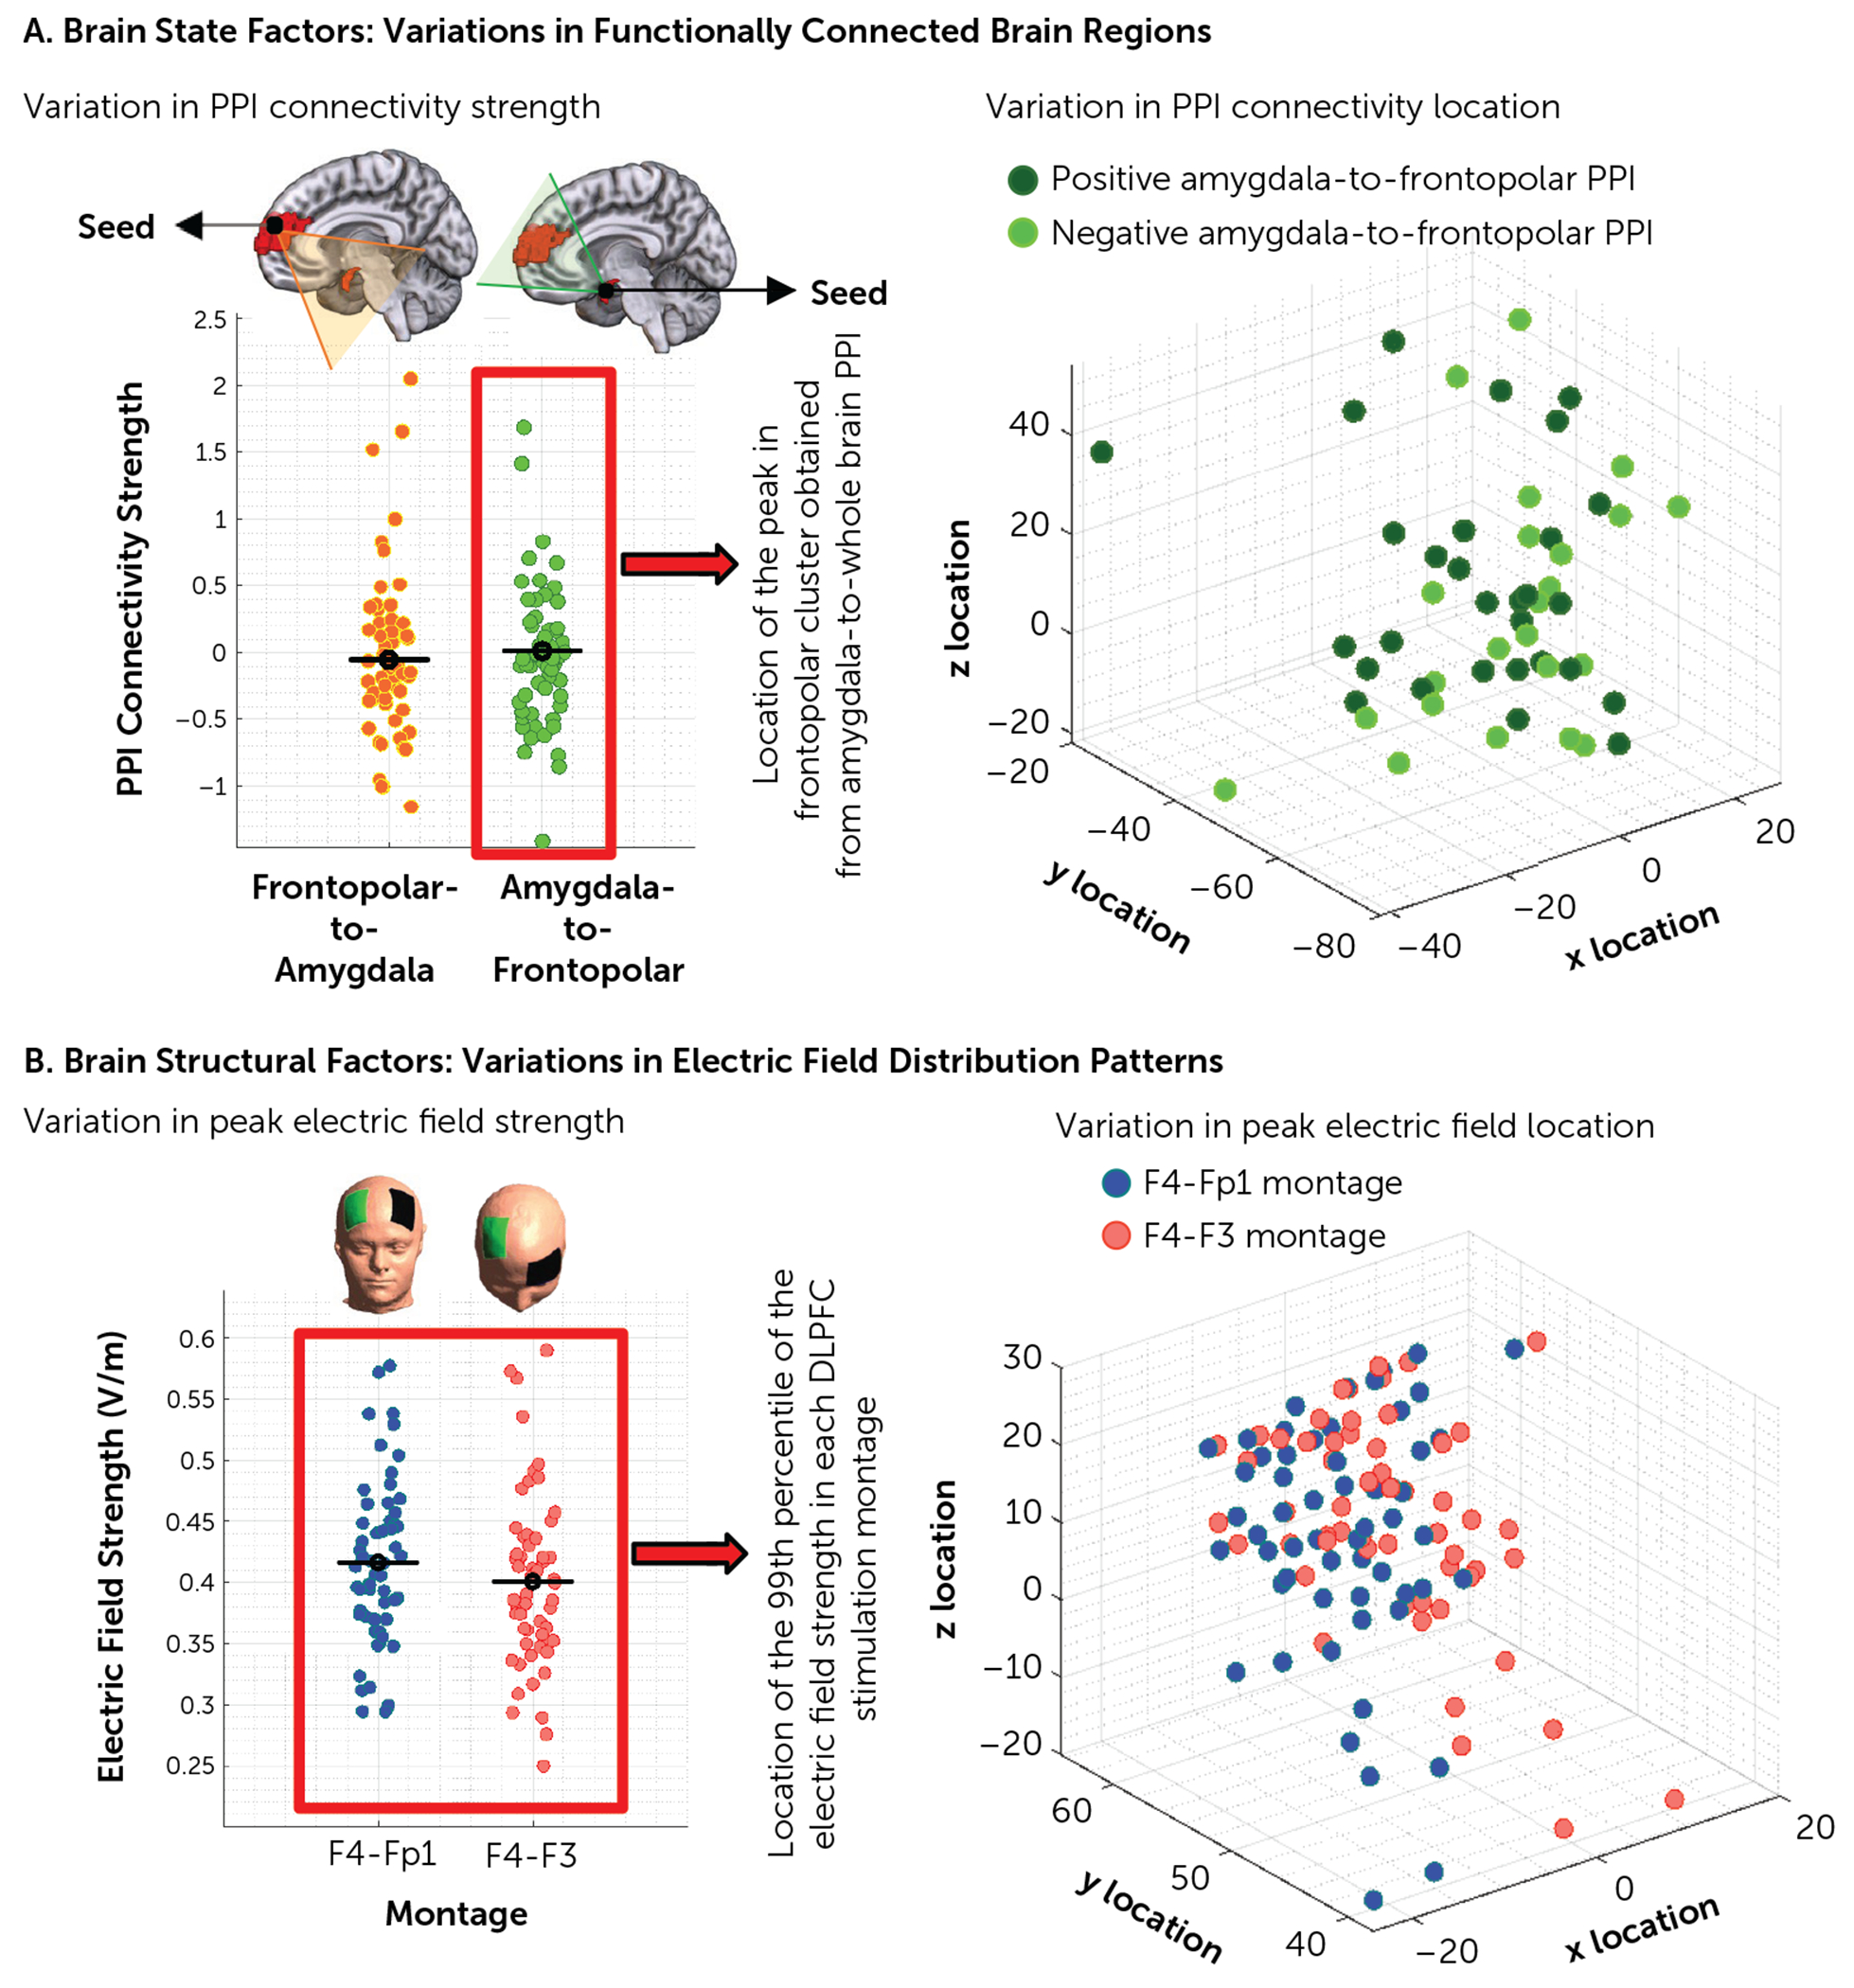
a Between-individual differences are visualized in terms of strength and the location of two main sources of variations (dots represent the data for individual subjects). Panel A illustrates brain state factors. Group-level frontopolar cortex-to-whole brain psychophysiological interaction (PPI) analysis showed a significant cluster in the amygdala, and group-level amygdala-to-whole brain PPI analysis showed a significant cluster in the frontopolar area. In the left-hand panel, PPI strength in each direction is presented for each subject. In the right-hand panel, the amygdala-to-whole brain peak location of the connected brain region in MNI space is represented for each subject; positive PPI connections are in dark green and negative PPI connections are in light green. Panel B illustrates brain structural factors. The left-hand panel shows electric field distribution patterns that were simulated for two of the most commonly used electrode montages, F4-Fp1 and F4-F3. The individualized strength of the 99th percentile of the electric field (which is commonly located in the frontopolar area) is presented for each montage; F4-Fp1 in red and F4-F3 in blue (left-hand panel). The location of the peak electric field in Montreal Neurological Institute space for each subject is also reported (right-hand panel). Results are reported for 60 participants with methamphetamine use disorder. DLPFC=dorsolateral prefrontal cortex.