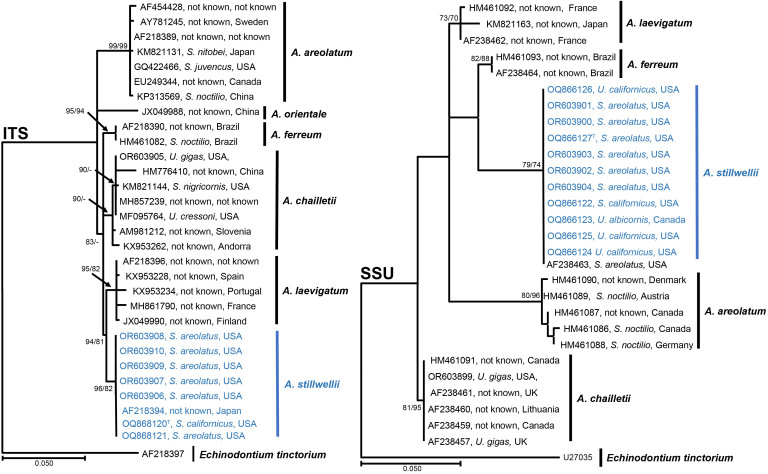
Fig. 2.
Phylogenetic tree based on Maximum Likelihood and Maximum Parsimony analysis of ITS and SSU. Maximum Likelihood analyses were performed using PhyML v.3.1 ( Guindon & Gascuel 2003, Darriba et al. 2012). PAUP v. 4.0b10 ( Maddison et al. 1997) was used for the Maximum Parsimony analyses. Bootstrap support values greater than 70 % are given at the nodes. Echinodontium tinctorium was used to root the tree. GenBank accession numbers are given in the tree and samples for the new species are in blue. Labels include the GenBank accession number, Siricid host and country of collection (− = support lower than 70 %).

