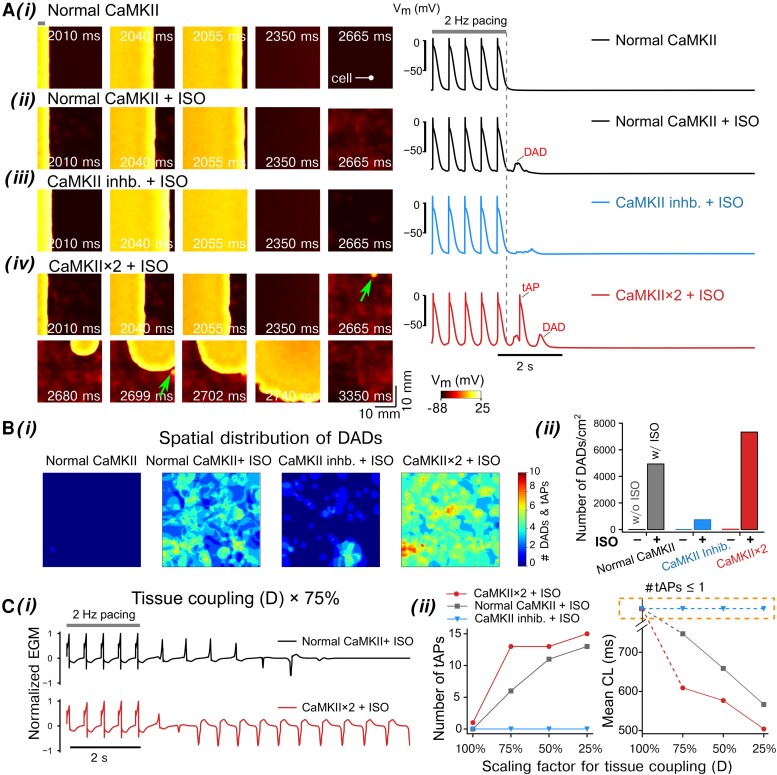
Figure 4.
Effects of PKA and CaMKII activation on the membrane instabilities in simulated 2D atrial tissue. The 2D tissue slab was paced from the left side [site width indicated with a bar in top left of panel (i)] using a 2 Hz pacing (five beats) and pause protocol. The total simulated time was 10 s. (A, left) Time-stamped snapshots of tissue cell membrane voltage map featuring membrane voltage changes following the last pacing at t = 2000 ms. (A, right) Time courses of single-cell AP extracted from the tissue. The cell location is indicated in (A) (i), left. Panels (i–iv) illustrate (i) normal CaMKII without ISO, (ii) normal CaMKII with ISO, (iii) CaMKII inhibition with ISO, and (iv) two-fold CaMKII expression with ISO. Triggered AP initiation is indicated by arrows. (B) (i) Spatial distribution and (ii) density of DAD incidences in the tissue slab following the cessation of the pacing protocol. (C) (i) Simulated electrograms (EGMs) from the tissue simulations at reduced gap junction conductance (scaled to 75%, D × 75%) for the normal vs. CaMKII × 2 with ISO application. (ii) Effects of CaMKII inhibition or two-fold CaMKII expression on the number of tAP propagation and cycle length (CL) for normal and reduced gap junction conductances (D scaled from 100 to 25%).

