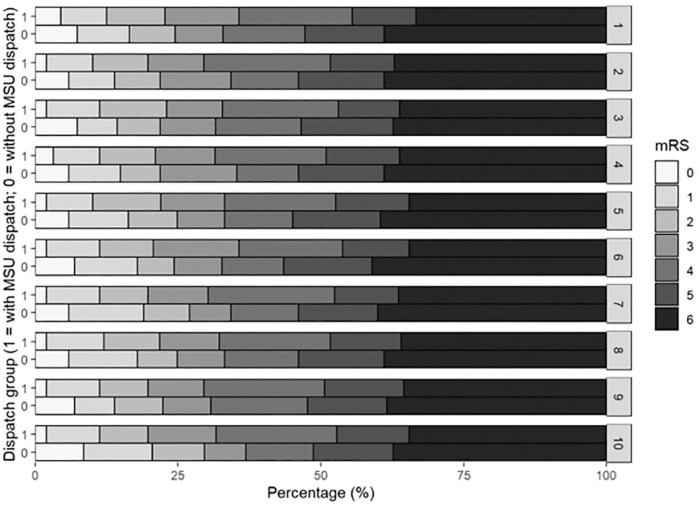
Figure 3.
Adjusted stacked proportional bar graph showing adjusted 3-month mRS score distributions for both groups (with MSU dispatch = l and without MSU dispatch = 0). mRS distributions by dispatch group are presented for each imputed data set (1–10). Confounding adjustment was performed using inverse probability of treatment weighting with stabilised weights.

