. 2024 Jun 3;20(7):453–468. doi: 10.1039/d3mo00187c

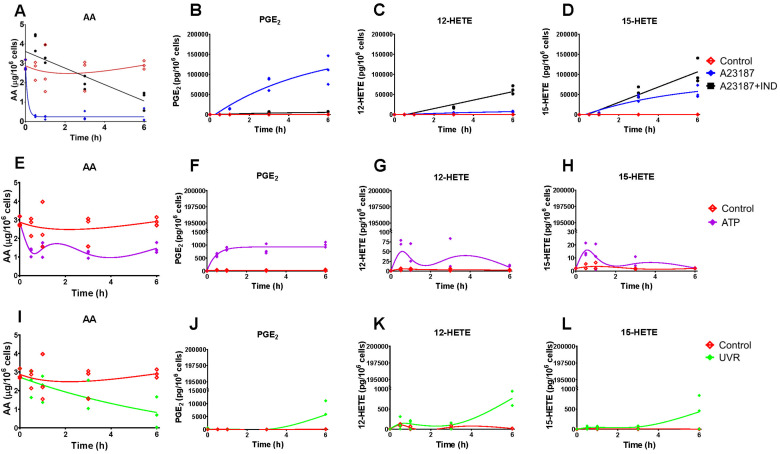
Fig. 3. Levels of cellular arachidonic acid (AA) and eicosanoids produced by HaCaT keratinocytes stimulated with calcium ionophore A23187 and indomethacin (IND) (A)–(D), ATP (E)–(H) and ultraviolet irradiation (UVR) (I)–(L). Eicosanoid production by untreated control cells (CTR; red) and post stimulation with A23187 (5 μM, blue), A23187 + IND (10 μM, black), ATP (2 mM, purple) and UVR (15 mJ cm−2, green) treatment was measured over time (0, 0.5, 1, 3 and 6 h) by UPLC/ESI-MS/MS; AA release was measured by GC-FID. Data shown as individual points, n = 3 independent experiments. Non-linear lines of best fit are shown for untreated control (red) and treated cells as a visual guide only, and do not imply a mechanistic model or most likely dynamics. Hydroxy-eicosatetraenoic acid, HETE; prostaglandin E2, PGE2.

Fig. 3