. 2024 Jun 3;20(7):453–468. doi: 10.1039/d3mo00187c

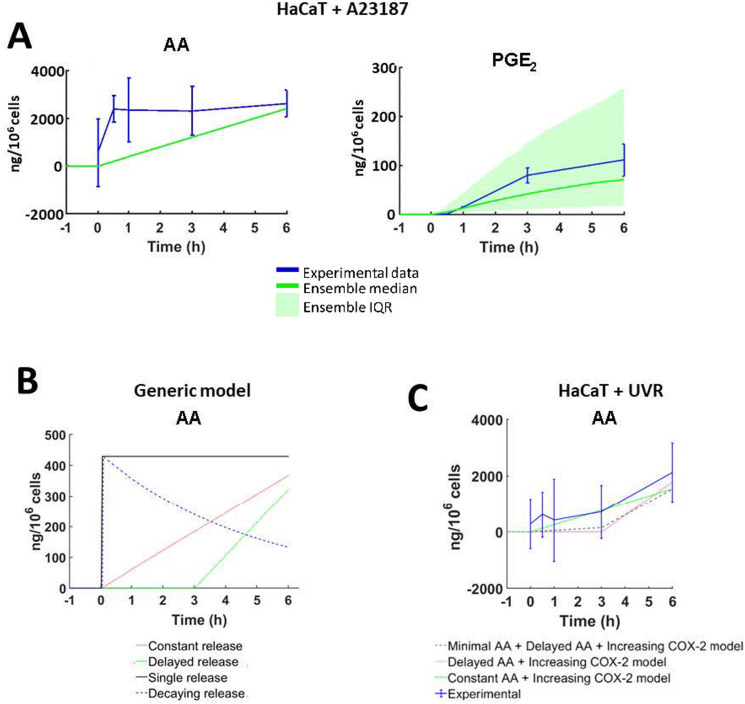
Fig. 7. Stimulus-specific adaptations to the arachidonic acid (AA) network models. (A) In silico AA concentrations simulated to reflect total in vitro eicosanoid production by HaCaT keratinocytes stimulated with calcium ionophore A23187 (5 μM). Experimental data shown as mean ± SD; (n = 3 independent experiments; in silico data shown as median ± the interquartile range (IQR) of 1000 model variants). (B) Four examples of the dynamic way AA can be introduced into the cascade: single pulse (black), constant (red), decaying (blue) and delayed (green). These examples were created by amending the value of parameters in eqn (1), at set time points (ESI, Table S14). (C) AA available for the eicosanoid cascade as predicted by the “HaCaT + UVR” optimisation models. ‘Minimal AA + Delayed AA + COX-2’ (grey), ‘Delayed AA’ (pink), ‘Constant AA + COX-2’ (green), ‘Constant AA’ (green) models; experimental data (blue) shown as mean ± SD, n = 3 independent experiments; in silico data shown as median ± the IQR of 1000 model variants.

Fig. 7