. 2024 Jun 3;20(7):453–468. doi: 10.1039/d3mo00187c

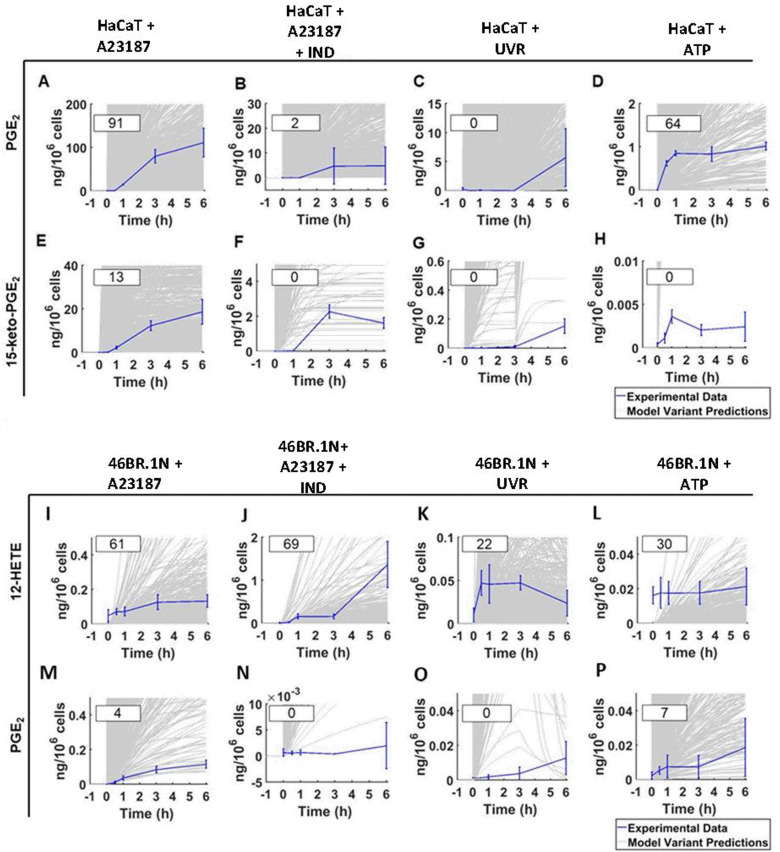
Fig. 9. Experimental data compared with the predicted data for examples of highly accurately and inaccurately predicted metabolites in the “HaCaT keratinocyte” in silico experiments (PGE2, high accuracy example; 15-keto-PGE2, low accuracy example) and “46BR.1N fibroblast” in silico experiments (12-HETE, high accuracy example; PGE2, low accuracy example). Predicted and experimental data, alongside calculated “Metabolite Ψ” scores, are shown for HaCaT keratinocytes stimulated with (A) and (E) calcium ionophore A23187, (B) and (F) calcium ionophore A23187 and the COX inhibitor IND, (C) and (G) UVR and (D) and (H) ATP. The HaCaT eicosanoid profiles shown are PGE2 (A)–(D) and 15-keto-PGE2 (E)–(H). Predicted and experimental data are shown for 46BR.1N fibroblasts stimulated with (I) and (M) calcium ionophore A23187, (J) and (N) calcium ionophore A23187 with the COX inhibitor IND, (K) and (O) UVR and (L) and (P) ATP. The 46BR.1N eicosanoid profiles shown are 12-HETE (I)–(L) and PGE2 (M)–(P). Experimental data shown as mean ± SD, n = 3 independent experiments (blue); in silico data shown based on an ensemble of 1000 model variants (grey); calculated “Metabolite Ψ” scores are listed in the upper left corner of each panel.

Fig. 9