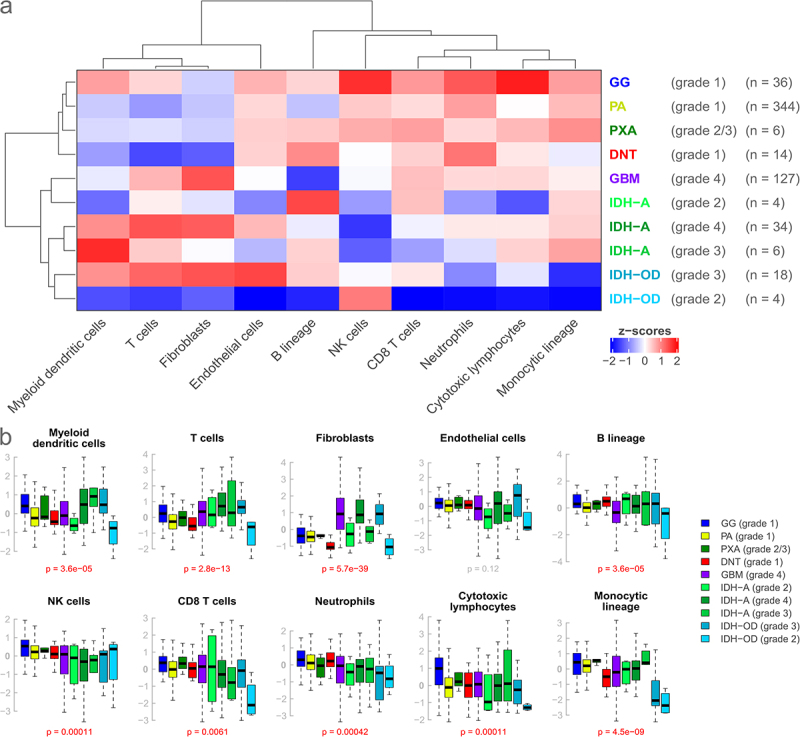
Figure 1.

Comparison of expression scores for 10 microenvironment cell populations in seven brain tumor entities subdivided by grade. (a): Heatmap based on the median expression score of every cell population for every entity. Entities generally considered low-grade and high-grade cluster together, respectively, and show distinct expression profiles. (b): Corresponding boxplots. Boxes indicate the lower and upper quartiles, with the black band indicating the median. Whiskers extend to 1.5*IQR, outliers beyond that are not shown. P-values are calculated by the Kruskal-Wallis test. Low- and high-grade entities show differences for some cell populations, but overall dispersion is large.
