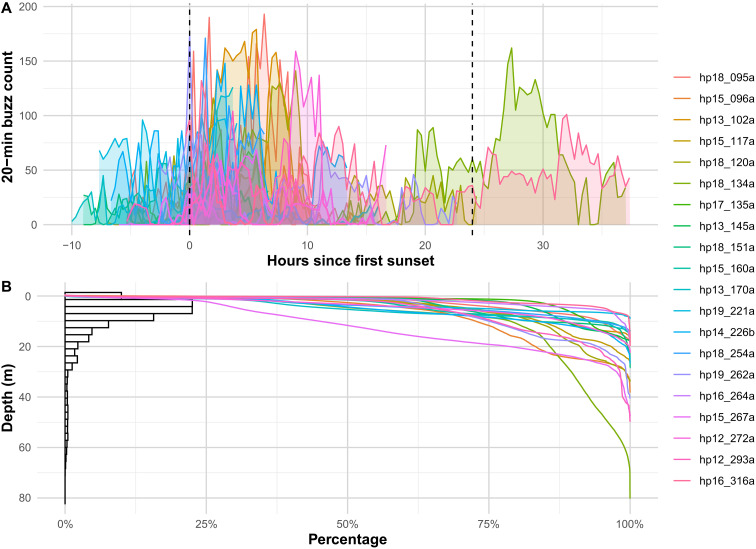
Fig. 2. Buzz production overview.
(A) Number of buzzes in 20-min bins as a function of time since sunset. Colored areas show the count for each tagged porpoise and the two dashed lines mark the time of first and second sunset. (B) Percentage of cumulative time spent above each water depth by individual porpoises (colored lines) and percentage of buzzes produced at each water depth pooling animals (bars, bin width = 3 m). The digits in the individuals’ ID indicate the year and Julian day of tag deployment and the letter indicates the order in which animals were tagged if multiple animals were tagged on the same day. Individuals are sorted by Julian day.

