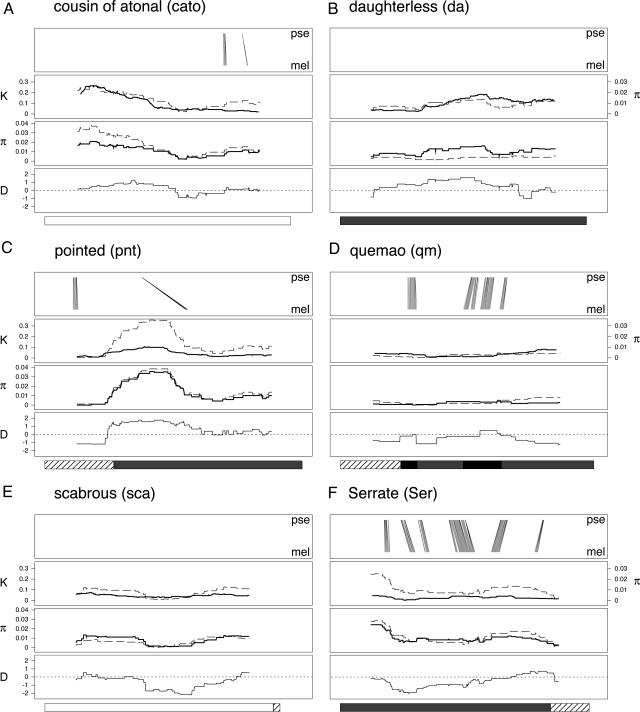
Fig. 2.
Signatures of selection across sequenced amplicons. Six of the 26 amplicons are detailed, and each is composed as follows. (Top) Conservation between D. melanogaster and D. pseudoobscura. Each line represents a blast hit (with a score >45) between a 31-bp subsection of the D. melanogaster consensus sequence and the homologous sequence from D. pseudoobscura, with the endpoints of each line showing the position of the hit in each genome. All blast hits are between subsequences in the same orientation. (Upper Middle) Nucleotide diversity (π) within D. melanogaster (dashed line), and divergence (K) between D. melanogaster and D. simulans (solid line). (Lower Middle) Nucleotide diversity within the lines derived from the single D. melanogaster population (dashed line), and within the worldwide panel of D. melanogaster strains (solid line). (Bottom) Tajima's D statistic (30). Below each figure is an annotation bar describing the type of sequence surveyed for each amplicon, with the shading as described in Fig. 1.

