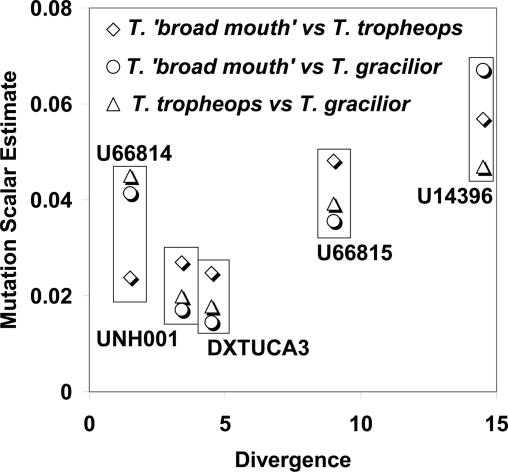
Fig. 2.
Mutation rate scalars, estimated in separate analyses for each species pair, are plotted against the average amount of sequence divergence between Tropheops and Eretmodus. The scalars are the estimated mutation rates relative to other loci (including STRs that are not shown) obtained by fitting the data to the IM model. Points are grouped for each of the five loci for which divergence could be measured.

