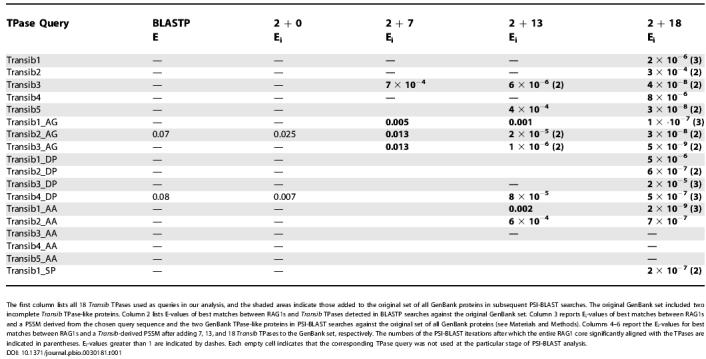
Table 1. Significance of Similarities between the Transib TPases and RAG1 Core.

The first column lists all 18 Transib TPases used as queries in our analysis, and the shaded areas indicate those added to the original set of all GenBank proteins in subsequent PSI-BLAST searches. The original GenBank set included two incomplete Transib TPase-like proteins. Column 2 lists E-values of best matches between RAG1s and Transib TPases detected in BLASTP searches against the original GenBank set. Column 3 reports Ei-values of best matches between RAG1s and a PSSM derived from the chosen query sequence and the two GenBank TPase-like proteins in PSI-BLAST searches against the original set of all GenBank proteins (see Materials and Methods). Columns 4–6 report the Ei-values for best matches between RAG1s and a Transib-derived PSSM after adding 7, 13, and 18 Transib TPases to the GenBank set, respectively. The numbers of the PSI-BLAST iterations after which the entire RAG1 core significantly aligned with the TPases are indicated in parentheses. Ei-values greater than 1 are indicated by dashes. Each empty cell indicates that the corresponding TPase query was not used at the particular stage of PSI-BLAST analysis.
