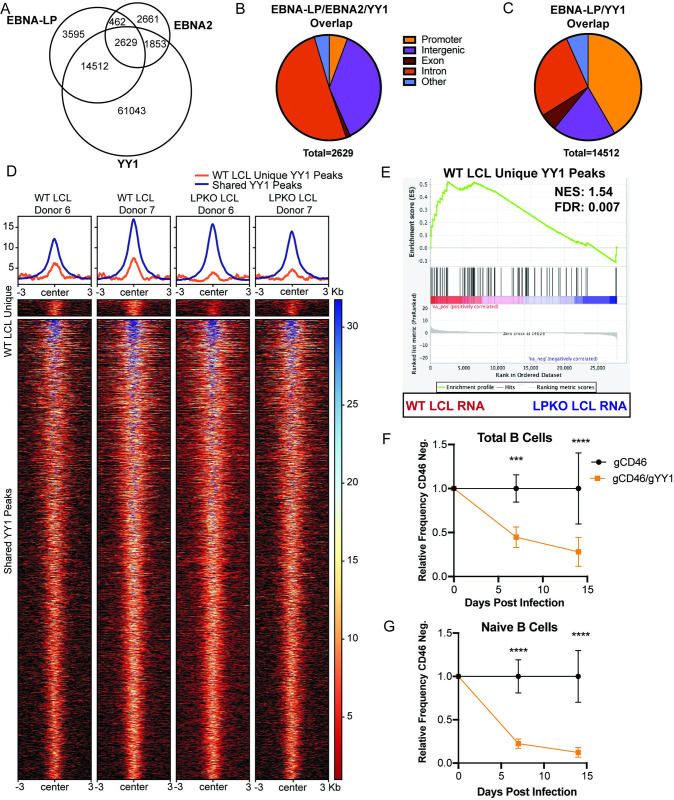
Fig 6. EBNA-LP and cellular transcription factor YY1 association on chromatin in LCLs.
A. EBNA-LP and EBNA2 localized sites on chromatin overlap with YY1 in LCLs by publicly available ChIP-Seq data. B. Location on chromatin of overlapping peaks between YY1, EBNA-LP, and EBNA2. C. Location on chromatin of overlapping peaks between exclusively YY1 and EBNA-LP. D. Heatmap of YY1 peaks gained in WT LCLs compared to LPKO (dark blue), or shared across WT and LPKO LCLs (light blue) in Donors 6 and 7. E. Gene Set Enrichment Analysis of YY1 peaks unique to WT LCLs compared to RNA-seq gene expression of WT and LPKO LCLs. NES = normalized enrichment score. FDR = false discovery rate q-value. F. Relative frequency of CD46 negative cells when total B cells were transfected with Cas9/gRNA complex targeting control surface marker CD46 or CD46 and YY1 prior to infection. G. Relative frequency of CD46 negative naïve B cells with CD46 or CD46 and YY1 knockout prior to infection. F and G experiments were statistically analyzed by two-way ANOVA followed by Sidak post-hoc test. *** indicates p-values < 0.001, **** indicates p-values < 0.0001.

