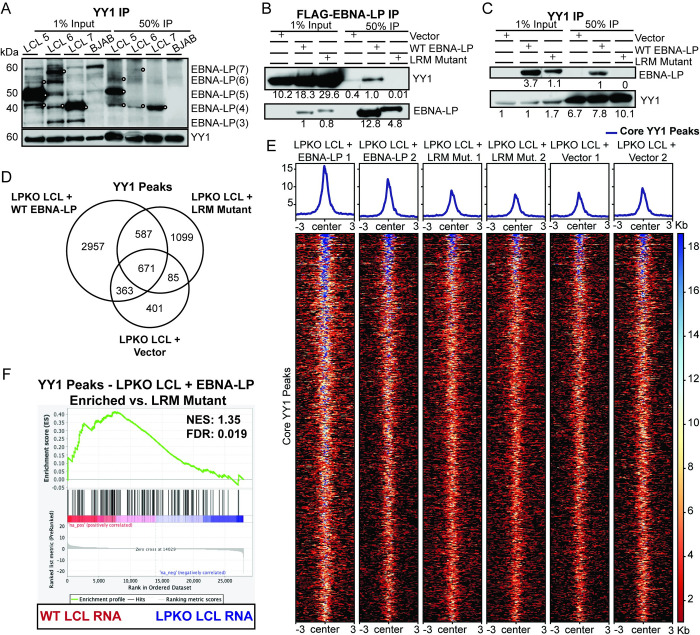
Fig 7. EBNA-LP associates with YY1 cellular transcription factor through leucine-rich motifs.
A. Endogenous co-immunoprecipitation in LCLs to YY1. White circles indicate EBNA-LP specific bands. BJAB, an EBV-negative cell line, was used as a negative control. Signal in BJAB lanes indicate non-specific background bands. W indicates the number of W domain in the indicated isoform. B. FLAG-EBNALP co-immunoprecipitation in LPKO LCLs (Donor 4) generated from trans-complementation of total B cells with vector control, wild type, or LRM mutant EBNA-LP. Signal is quantified below band. C. YY1 co-immunoprecipitation in trans-complemented LPKO LCLs. D. Venn diagram of YY1 peaks identified by Cut&Run in LPKO trans-complemented LCLs (Donor 4). E. Heatmap of the identified 671 core YY1 binding sites shared across all three conditions. F. Gene set enrichment analysis of genes associated with YY1 peaks that are significantly enriched in LPKO LCLs trans-complemented with wild type EBNA-LP compared to LRM mutant against the differentially expressed genes in WT and LPKO LCLs. NES = normalized enrichment score. FDR = false discovery rate q-value.

