
Figure 1.
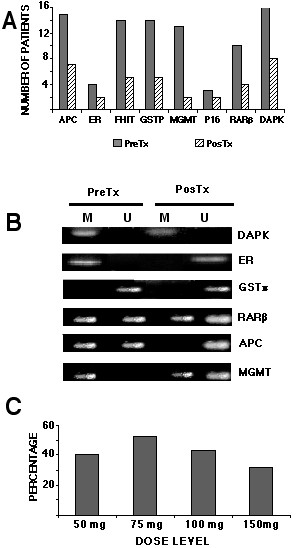
1A. Pre- (dark bars) and post-hydralazine treatment (light bars). The bars represent the number of patients that showed methylation for each studied gene from each of the 16 patients. 1B. Representative cases of genes (M methylated, U unmethylated; pre/post): M/M; M/U; U/U, M/U; MU/U; M/ U-M. 1C. Percentage of demethylation after treatment according to the dose. Percentage was calculated considering 100% methylation the total number of pre-treatment methylated genes in each cohort of 4 patients