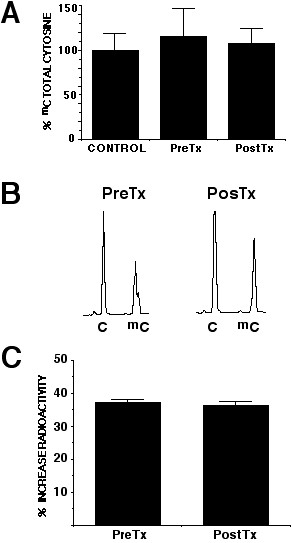
Figure 5.

5A. Capillary electrophoretic analysis of global methylation. Relative methylation showed no variation in percentage of mC after treatment (37.3% versus 36.3%). 5B is a electropherogram showing the separation of C and mC. 5C is the percent increase in radiolabeled incorporation pre and post-treatment as compared to the control of undigested DNA.
