. 2024 Aug 12;10(8):001277. doi: 10.1099/mgen.0.001277

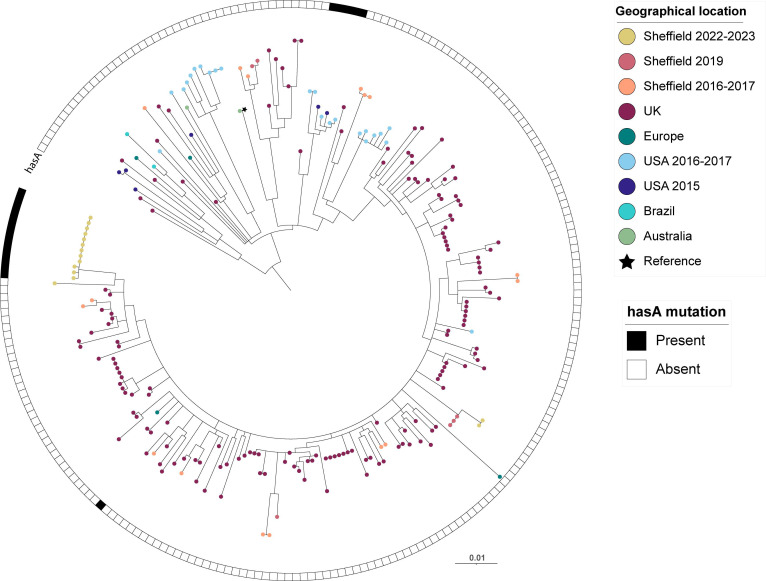
Fig. 8. Phylogenetic analysis of Sheffield emm75 genomes collected in 2022–2023 and 2016–2017, within the context of global emm75 isolates. A maximum likelihood phylogenetic tree was generated with the core gene alignment to reference strain M75 (star) (GenBank CP033621.1 [69]). Alongside our Sheffield emm75 genomes from 2022–2023 and 2016–2017, we included publicly available emm75 genome data from Sheffield, 2019 (n=6) [28]; the UK, 2011–2016 (n=158) [31,55, 56, 59]; Belgium, 2004 (n=1) [68]; the USA, 2015–2017 (n=81) [38,62]; Australia, 1991–2010 (n=7) [68]; and Brazil, 2007–2012 (n=2) [68]. The scale bar represents the number of nucleotide substitutions per site. The presence or absence of a hasA nonsense mutation is indicated for each strain. Only isolates of ST150 (and closely related STs) are shown, excluding the other major lineage of emm75 (ST49 and closely related) as these are genetically quite distant [31]. Those that were ST49 and closely related STs comprised genomes from the UK, 2014–2018 (n=3) [56]; the USA, 2015 (n=14) and 2016–2017 (n=38) [38,62]; Australia, 1991–2004 (n=6) [68]; Fiji, 2006 (n=3) [68]; India, 2007–2010 (n=2) [68]; and Kenya, 2000–2011 (n=5) [68]. No Sheffield isolates were ST49.

Fig. 8.