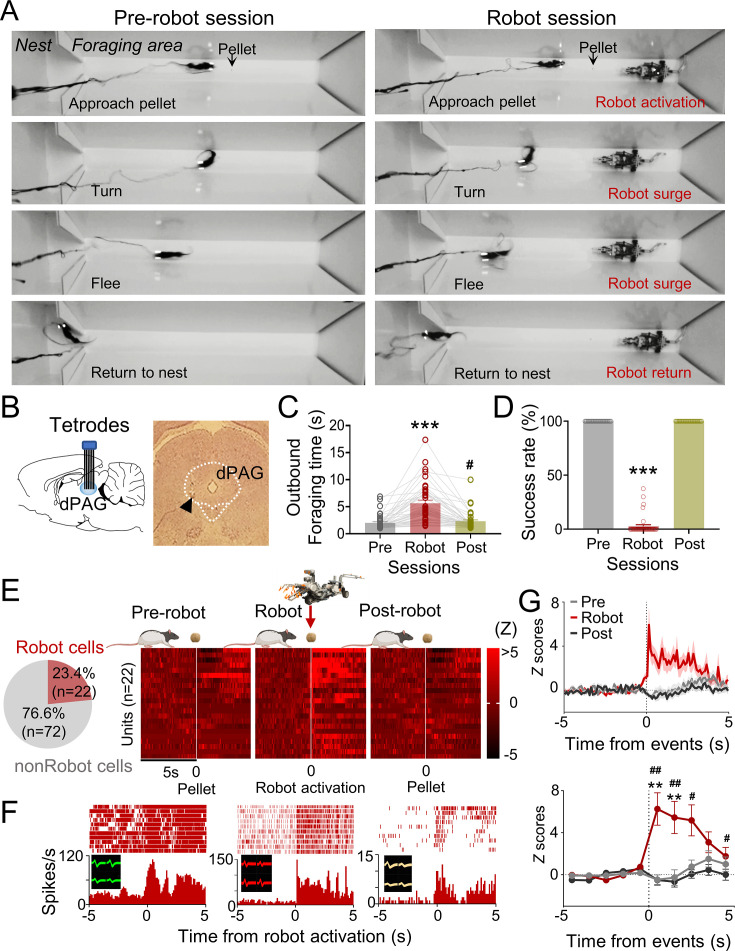
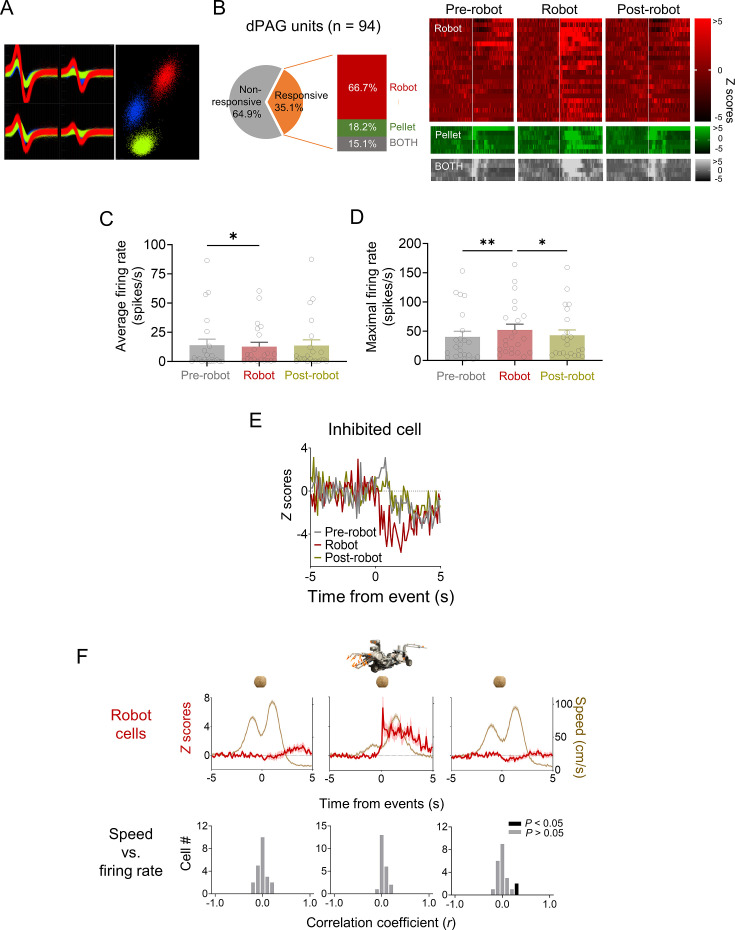
Figure 1. Dorsal periaqueductal gray (dPAG) single-unit recordings during risky foraging.
(A) Rats underwent pre-robot, robot, and post-robot sessions, successfully securing pellets in pre- and post-robot trials, and failing during robot trials due to robot interference. (B) Tetrode implantation in dPAG with a photomicrograph of the tip (arrowhead). (C) Outbound foraging time increased significantly in the robot session (Χ2 = 64.00, p<0.0001, Friedman test; ps<0.05 for all comparisons, Dunn’s test, n = 42 recording days from 5 rats). ***p<0.001 compared to pre-robot and post-robot sessions. #p<0.05 compared to the pre-robot session. (D) The pellet success rate significantly decreased during robot session (Χ2 = 84.00, p<0.0001, Friedman test; ps<0.0001 for all comparisons, Dunn’s test, n = 42 recording days from 5 rats). ***p<0.001 compared to pre-robot and post-robot sessions. (E) Cell-type proportions revealed that 23.4% cells responded to robot activation (robot cells). (F) Representative dPAG robot cell raster/event histograms aligned with robot activations. (G) Population activity of robot cells around the time of robot activation (t = 0) with 0.1 s and 1 s bins. Firing rates of the robot cells were higher during robot session (0–3 s blocks; Friedman test, all Χ2s > 6.952, all ps<0.05; Dunn’s test, all ps<0.05, n = 22 units). Shaded areas indicate SEM. **p<0.01 compared to pre-robot session. #, ##, and ### denote p<0.05, p<0.01, and p<0.001, respectively, compared to post-robot session. Panel (E) created with BioRender.com, and published using a CC BY-NC-ND license with permission.
© 2024, BioRender Inc
Figure 1E was created using BioRender, and is published under a CC BY-NC-ND 4.0. Further reproductions must adhere to the terms of this license.


