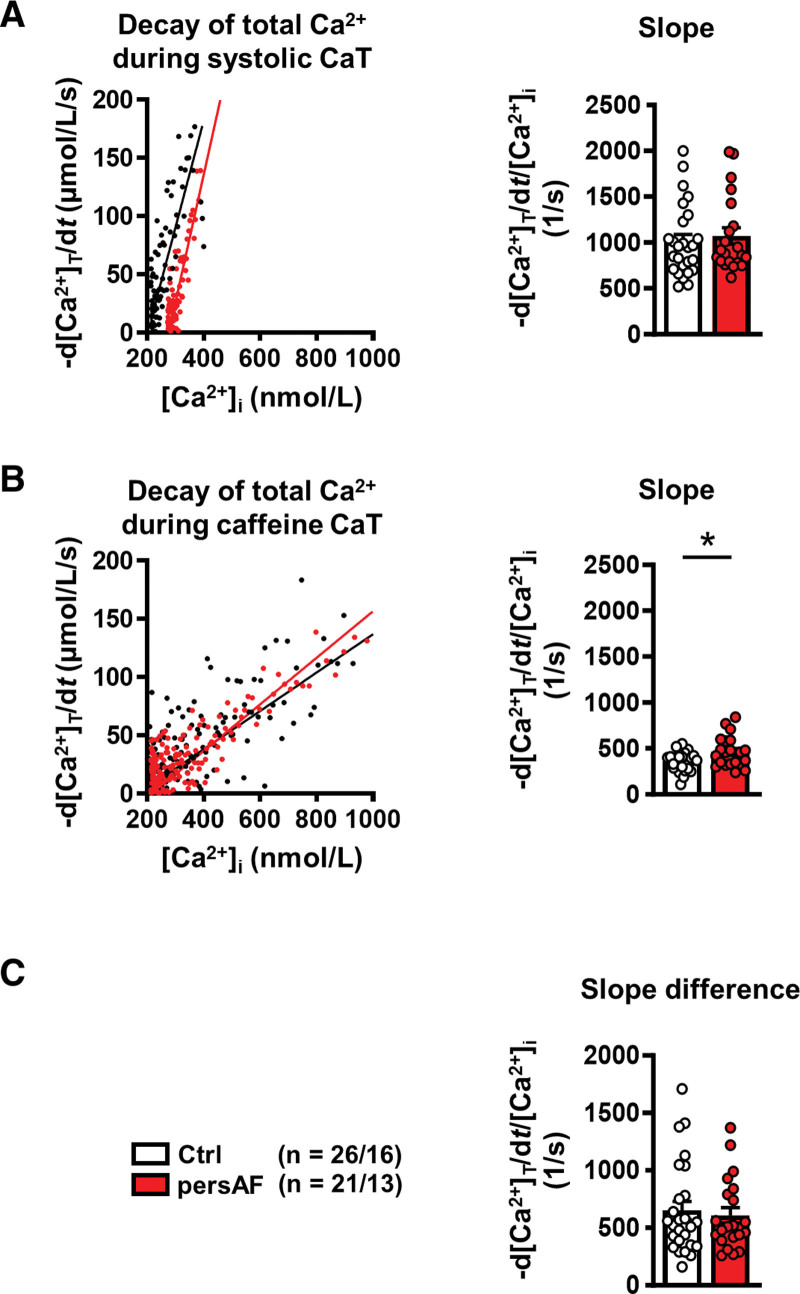
Figure 4.
Quantification of decay of total Ca2+ in atrial myocytes isolated from patients without (control) and with persAF. A, Representative rate of decay of total Ca2+ (-d[Ca2+]T/dt) plotted during systolic CaT against free [Ca2+]i (left) and slope of -d[Ca2+]T/dt plotted against [Ca2+]i (right). B, Representative rate of decay of total Ca2+ during caffeine-induced Ca2+ transient (-d[Ca2+]T/dt) plotted against the corresponding free [Ca2+]i (left) and slope of -d[Ca2+]T/dt during caffeine plotted against corresponding [Ca2+]i (right). C, Difference between slopes in A and B, indicating unaltered [Ca2+]i dependence of SERCA-mediated Ca2+ removal. *P<0.05 vs control. n/N=number of myocytes/patients. Normality of data was determined by Shapiro-Wilk test, whereas comparison was made using the Student t test with Welch correction and Mann-Whitney U test for normally and nonnormally distributed data, respectively. Ctrl indicates control; and persAF, persistent atrial fibrillation.

