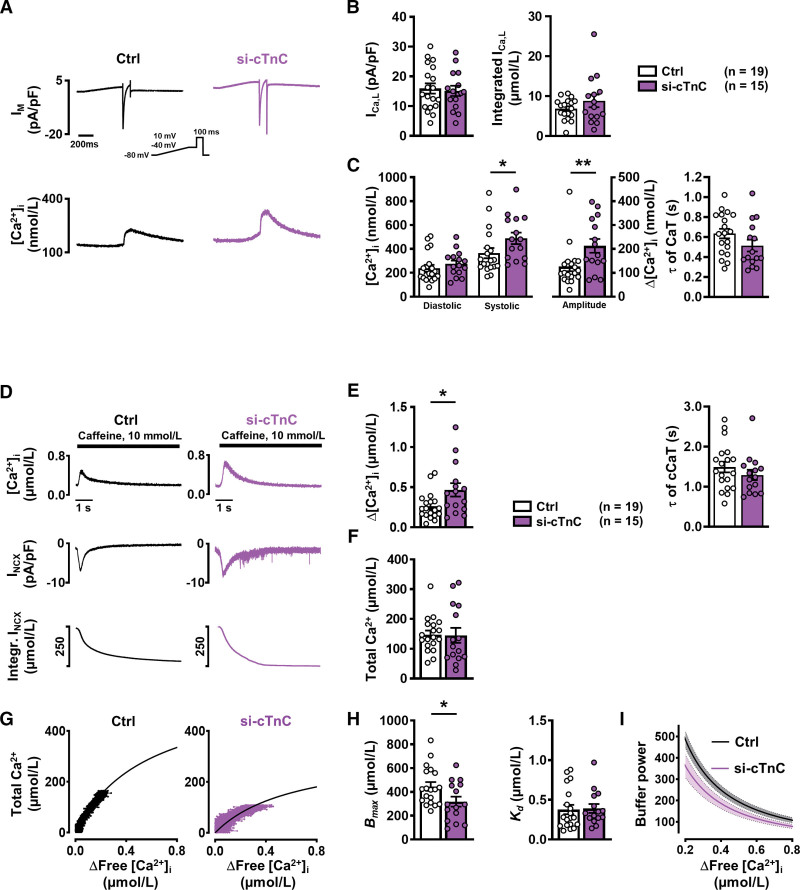
Figure 5.
Ca2+ handling and Ca2+ buffering properties in atrial iPSC-CMs with normal (control) and reduced (si-cTnC) cTnC levels. A, Representative simultaneous recordings of ICa,L (upper, inset, voltage-clamp protocol, 1 Hz) and triggered CaT (lower). B, Mean±SEM peak ICa,L (left) and integrated ICa,L (right) in control (siRNA ns) and si-cTnC (siRNA cTnC) iPSC-CMs. C, Mean±SEM diastolic and systolic [Ca2+]i (left) and resulting CaT amplitude (middle), and time constant (τ) of decay (right). D, Representative caffeine-induced CaT (upper), associated INCX (middle) and integral of inward current, corrected for cell volume to give a measure of total Ca2+ (lower). E, Mean±SEM amplitude (left) and time constant (τ) of decay (right) of caffeine-induced CaT. F, Mean±SEM calculated total Ca2+. G, Buffer curves showing the relationship between cytosolic free Ca2+ and total Ca2+, fitted with a hyperbolic function. H, Mean±SEM maximum buffering capacity (Bmax, left) and dissociation constant (Kd, right), determined from buffer curves. I, Mean±SEM of calculated individual total buffer power curves as a function of free [Ca2+]i. *P<0.05, **P<0.01 vs control. n=number of myocytes (2–4 differentiations). Normality of data was determined by Shapiro-Wilk test, whereas comparison was made using the Student t test and Mann-Whitney U test for normally and nonnormally distributed data, respectively. Ctrl indicates control; cTnC, cardiac troponin C; CaT, Ca2+ transient; iPSC-CM, induced pluripotent stem cell–derived cardiac myocyte; ns, nonsilencing; and siRNA, small interfering RNA.

