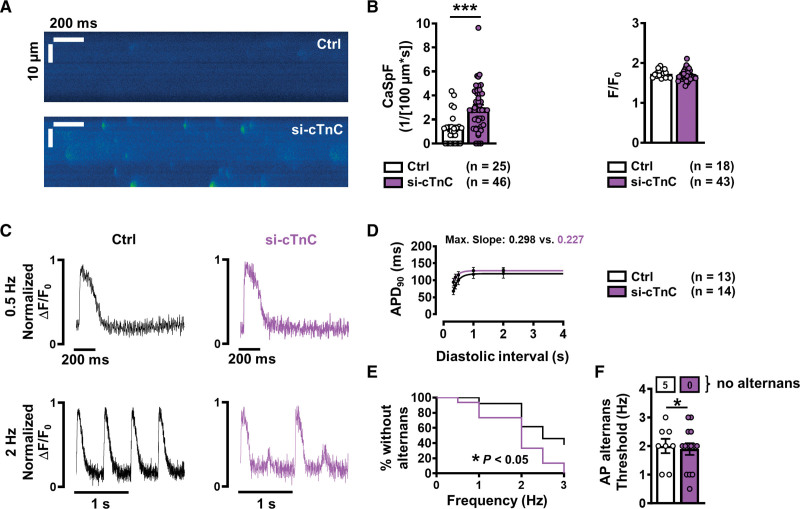
Figure 6.
Incidence of Ca2+ sparks and action potential (AP) alternans in atrial iPSC-CMs with normal (control) and reduced (si-cTnC) cTnC levels. A, Representative confocal line scans showing SR Ca2+ release in the form of Ca2+ sparks in control (siRNA ns) and si-cTnC (siRNA cTnC) iPSC-CMs. B, Mean±SEM Ca2+ spark frequency (CaSpF, left) and amplitude (right). C, Representative normalized traces of AP at 0.5 Hz (upper) and 2 Hz (lower) in control (left) and si-cTnC iPSC-CMs. D, AP duration at 90% repolarization (APD90) at increasing diastolic intervals (AP restitution), fitted with a 1-phase association nonlinear function to determine maximum curve slope. E, Kaplan-Meier plot indicating the percentage of iPSC-CMs without alternans in relation to the respective pacing frequency. F, Mean±SEM alternans threshold frequency. Number of myocytes without AP alternans are shown in boxes above. ***P<0.001, *P<0.05 vs control. n=number of myocytes (2 or 3 differentiations). Comparison was made using the unpaired Student t test, the Mann-Whitney U test, and the Gehan-Breslow-Wilcoxon test (E). Ctrl indicates control; cTnC, cardiac troponin C; iPSC-CM, induced pluripotent stem cell–derived cardiac myocyte; ns, nonsilencing; and siRNA, small interfering RNA.

