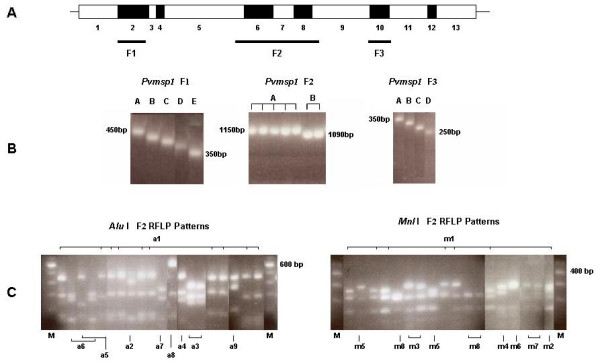
Figure 3.

A. Schematic representation of the Pvmsp1 gene for the localization of interallele conserved blocks (blank boxes) and variable blocks (black boxes). The position of the three amplified segments (F1, F2 and F3) is indicated by the horizontal bold lines. B. Gel electrophoresis of PCR products of a selection of fragments, corresponding to the three segments, amplified from different isolates. The molecular size of the largest and smallest bands are indicated. C. Analysis of the diversity of the F2 segment by PCR-RFLP using Alu I or Mnl I. A selection of lanes is labelled to indicate the type of variant observed (corresponding to the nomenclature in Table 3). A 100 bp ladder was used a molecular weight marker (M) for all the gels.
