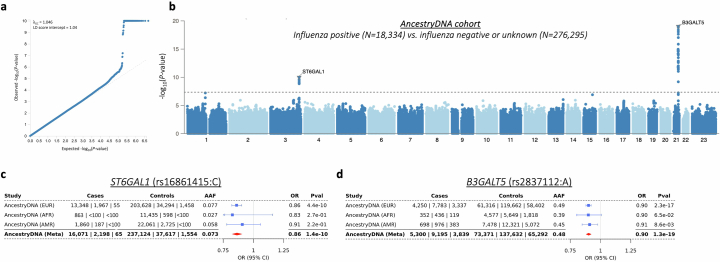
Extended Data Fig. 1. Results from the discovery GWAS of reported influenza infection in the AncestryDNA cohort.
We tested 10 million common (alternate allele frequency [AAF] > 1%) variants, derived from array genotyping followed by HRC imputation, comparing 18,334 individuals who reported a positive test for influenza (cases) against 276,295 individuals who did not report a positive test for influenza (controls). a, Quantile-quantile plot showing observed P-values for individual variants (y-axis) against P-values expected by chance given multiple testing (x-axis). The genomic inflation factor (λGC) of this analysis was 1.05, whereas the intercept from LD-score regression was 1.04. b, Manhattan plot showing association (−log10 P-value) with imputed variants. The dotted grey line demarcates the genome-wide significance threshold of P = 5 × 10⁻⁸. c,d, Genetic ancestry-specific results for the 3q27.3/ST6GAL1 (c) and the 21q22.2/B3GALT5 (d) variants. Unadjusted P-values derived from Firth-regression (two-sided test) implemented in REGENIE9. Error bars represent the 95% confidence interval around the odds ratio (data point).

