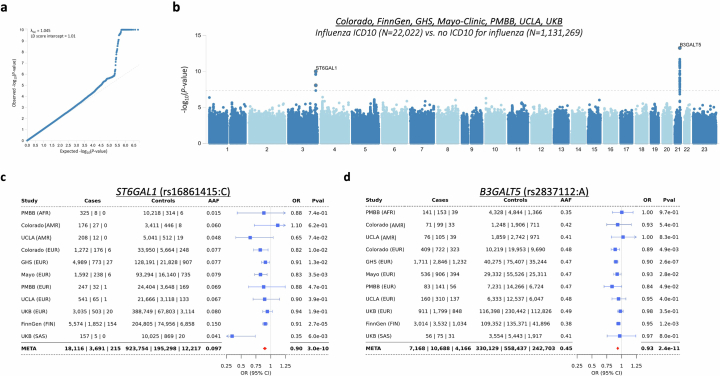
Extended Data Fig. 2. Summary of results from the replication GWAS of lifetime medical record-based influenza infection performed across seven biobanks.
We tested 11 million common (AAF > 1%) variants derived from array genotyping followed by TOPMed imputation (except FinnGen, which used an imputation reference panel comprising samples from Finland), comparing 22,022 individuals with (cases) against 1,131,269 individuals without (controls) an ICD-10 code for influenza (controls). a, Quantile-quantile plot showing observed P-values for individual variants (y-axis) against P-values expected by chance given multiple testing (x-axis). The genomic inflation factor (λGC) of this analysis was 1.04, whereas the intercept from LD-score regression was 1.01. b, Manhattan plot showing association (−log10 P-value) with imputed variants. The dotted grey line demarcates the genome-wide significance threshold of P = 5 × 10⁻⁸. c,d, Cohort-specific results for the 3q27.3/ST6GAL1 (c) and the 21q22.2/B3GALT5 (d) variants. Unadjusted P-values derived from Firth-regression (two-sided test) implemented in REGENIE9. Error bars represent the 95% confidence interval around the odds ratio (data point).

