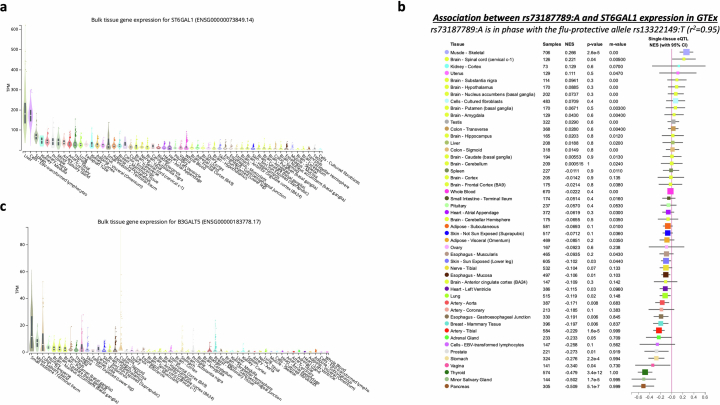
Extended Data Fig. 6. Expression of ST6GAL1 and B3GALT5 across human tissues measured by the GTEx consortium.
a, Expression levels expressed as transcripts per million (TPM) per tissue in GTEx for ST6GAL1. Box plots show the interquartile range (ICR) and the median. Sample sizes for each tissue can be found on the GTEx website (see Data Availability). b, Association between rs73187789:A and expression levels of ST6GAL1 across tissues. Variant rs73187789 was a lead independent eQTL for ST6GAL1 in thyroid tissue and was in high LD (r2 = 0.95) with the lead variant associated with risk of influenza in ST6GAL1. Error bars represent the 95% confidence interval around the normalized effect size (NES) from linear regression. c, Expression levels expressed as TPM per tissue in GTEx for B3GALT5. Box plots show the ICR and the median. Sample sizes for each tissue can be found on the GTEx website (see Data Availability).

