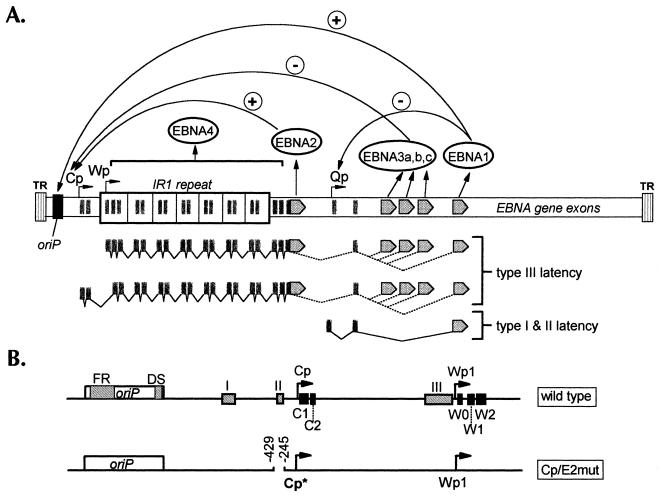
FIG. 1.
(A) Schematic diagram of the linearized EBV genome. EBNA open reading frames are indicated as gray arrows. The functions of the various EBNAs for regulating viral promoter activity are indicated with plus and minus signs. Viral transcription programs during type I, II, and III latencies are indicated below the genome diagram. TR, terminal repeat; IR, internal repeat; Qp, Q promoter. (B) Diagram of regulatory regions controlling Cp and Wp activities. The top diagram shows wild-type viral DNA sequences. oriP, latency origin of replication. Gray box I indicates the location of the glucocorticoid response element. Box II indicates the location of the Cp EBNA2-responsive enhancer. Box III indicates the location of the shared Cp-Wp enhancer. The C1, C2, W0, W1, and W2 exons are shown as black boxes. The bottom diagram represents the targeting plasmid used to incorporate the Cp EBNA2-responsive enhancer deletion into the viral genome. Cp*, tagged Cp in which the C1 exon contains a nucleotide sequence tag as previously described (23).

