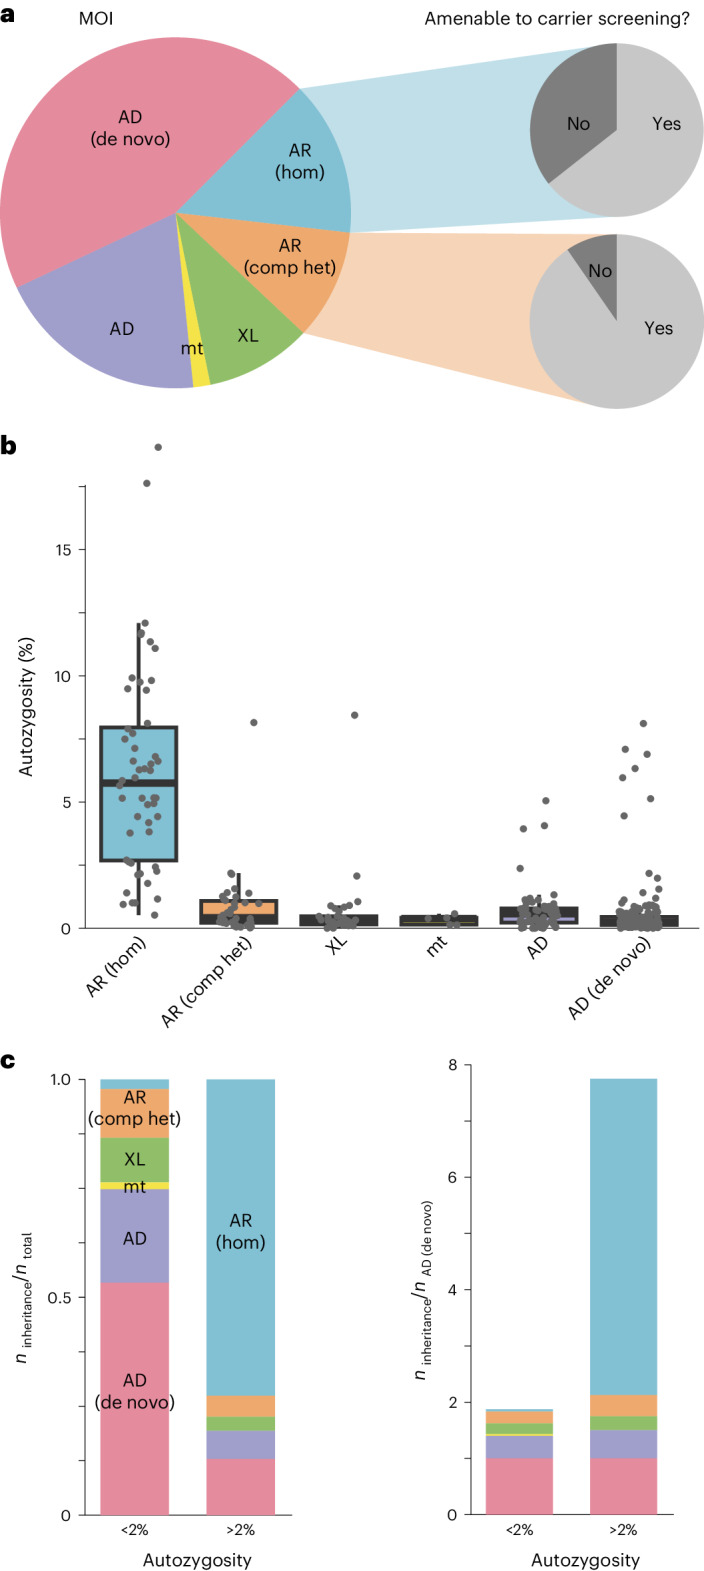
Fig. 3. Mode of inheritance and disease burden are dependent on autozygosity.

a, Pie chart showing the distribution of modes of inheritance (MOI) for all diagnoses (n = 510). Most disease-causing variants occurred de novo and on an autosome. At least 75% of all autosomal recessive diagnoses could have been identified by expanded carrier screening (slice). b, Box plots of autozygosity for each MOI (n = 375). Individuals are indicated by gray dots. Autozygosity was substantially increased in individuals with autosomal recessive disorders due to homozygous variants. In the box plots, the center lines indicate the median values, and the bottom and top edges of the boxes are the first (25%) and the third (75%) quartiles. The whiskers extend to the minimal and maximal data points with a maximum distance of 1.5 interquartile ranges from the edges of the box. c, Bar graphs illustrating MOI in individuals with low (<2%, n = 313) and high (>2%, n = 62) autozygosity. On the right, the autosomal dominant de novo rate has been used for normalization. Individuals with high autozygosity had a higher relative burden of recessive diseases, mainly due to the presence of homozygous pathogenic variants. The box plots present the median as the center line, the upper and lower quartiles as box limits, and 1.5× the interquartile range as the whisker length (in the style of Tukey). AD, autosomal dominant inheritance, variant inherited or of unknown origin; AD (de novo), autosomal dominant inheritance with de novo variant; AR (comp het), autosomal recessive inheritance with compound heterozygous variants; AR (hom), autosomal recessive inheritance with homozygous variant; mt, mitochondrial inheritance; XL, X-linked inheritance.
