
Fig. 4. Most variants identified in TRANSLATE NAMSE exome sequencing cohort cause ultrarare disorders that were first associated with a gene in the last decade.
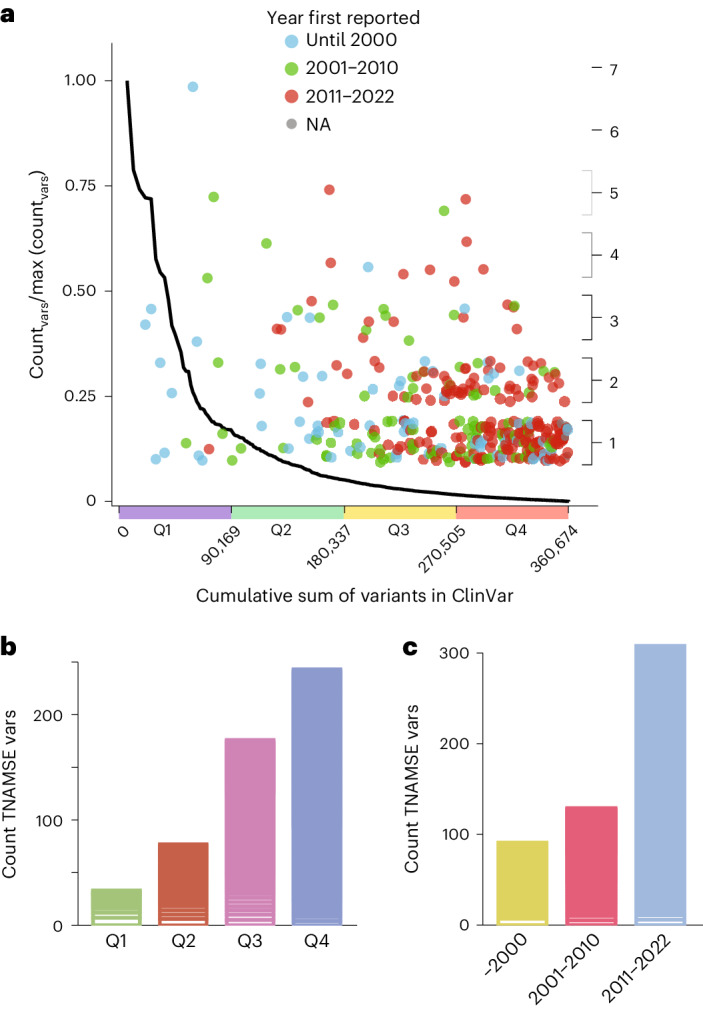
a, Comparison of the number of (likely) pathogenic variants per gene in TRANSLATE NAMSE relative to the frequency of submission of (likely) pathogenic variants to ClinVar. Genes are ordered from left to right according to a decreasing frequency of ClinVar submissions. The black line corresponds to the complementary cumulative distribution (1 − CDF; cumulative distribution function) of ClinVar submissions. Diagnostic variants in TRANSLATE NAMSE (counts displayed on the right axis) were plotted as dots above their respective gene and in the color corresponding to the year in which the gene was first described as being associated with the respective disease. b, Variant counts in TRANSLATE NAMSE in genes with high (first quartile, Q1) to low (Q4) counts of submissions per gene in ClinVar. The genes in Q1–Q4 each cover approximately 1/4 of the submissions of likely or confirmed pathogenic variants to ClinVar, as shown on the x axis in a. Variants in the same gene are grouped in horizontal blocks. c, Bar graph showing the number of variants relative to the time interval in which the gene was first described as being associated with the respective disease. Note that 59 genes listed in the recommendations for reporting of secondary findings (version 2) of the ACMG were excluded from the analyses to counteract potential biases in ClinVar due to submissions of secondary findings67. TNAMSE, TRANSLATE NAMSE; vars, variants.