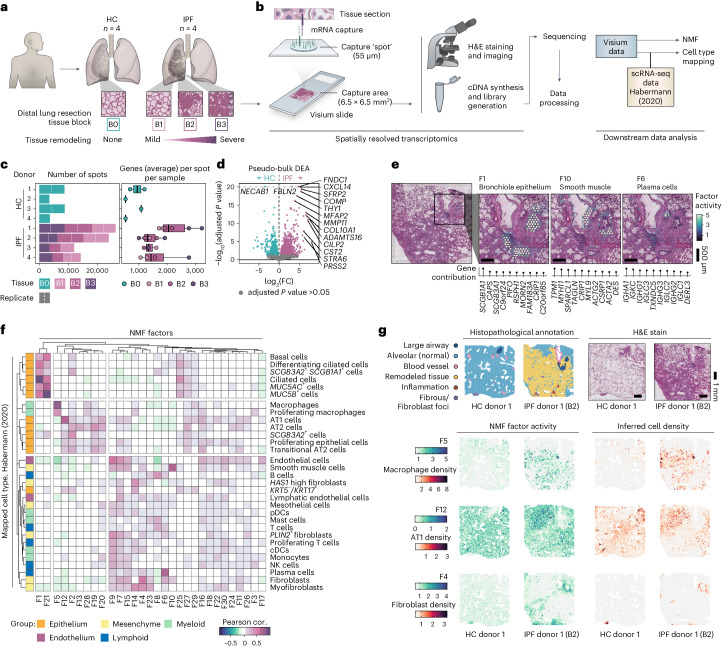
Fig. 1. Spatial transcriptomic profiling of human pulmonary fibrosis.
a, Tissue sections from distal lung resection samples from HCs (B0; n = 4) and patients with IPF (n = 4), were sectioned and analyzed using the Visium Spatial Gene Expression technology. Three tissue blocks exhibiting progressive tissue remodeling (B1–3) were selected from each IPF donor. b, Schematic illustration of the Visium workflow and subsequent data processing steps. NMF was used for dimensionality reduction, generating 30 distinct factors. Cell-type distributions were inferred through integration with a scRNA-seq dataset published by Habermann et al.5 (2020; GSE135893). c, Summarizing descriptions of the data, including the number of Visium capture spots per sample and the average number of unique genes detected per spot and sample. The box plot center line is the median, the box limits are the upper and lower quartiles, the whiskers are 1.5× interquartile range and the points are the value per Visium sample. d, Pseudobulk DEA comparing pooled HC and IPF Visium data per donor to identify significant DEGs between conditions based on data from entire tissue sections. e, Spatial distribution maps for selected NMF factors that correspond histological and/or transcriptional profiles of bronchiole epithelium (F1), smooth muscle (F10) and plasma cells (F6). f, Pearson correlation (cor.) heat map of NMF factor activity and inferred cell-type densities, using the Habermann et al. scRNA-seq dataset, across all spots in all samples. g, Example of histopathological annotations performed on sections from each HC and IPF tissue block based on the H&E-stained Visium sections. Visualizing spatial NMF activity and inferred cell-type densities showcases the colocalization of highly correlated factor-cell pairs. NMF, non-negative matrix factorization; pDC/cDCs, plasmacytoid/classical dendritic cells; NK cells, natural killer cells.

