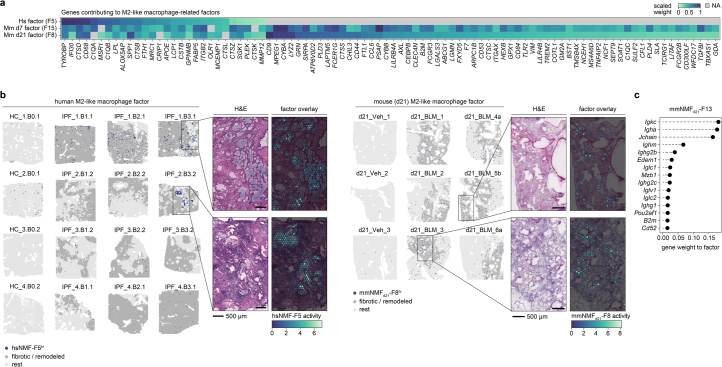
Extended Data Fig. 5. Profibrotic macrophages and immune cell profiles.
a) Heatmap showing the gene contributions to the identified M2-like macrophage-related factors across human lungs (hsNMF-F5) and mouse lungs at day 7 (d7) (mmNMFd7-F15) and day 21 (d21) (mmNMFd21-F8). The visualized genes are those, among the top 100 contributing genes, that overlapped between at least two of the three groups. Color represents each gene’s factor contribution as their scaled weight, where 1 is assigned to the strongest contributing gene to the factor out of all genes in the data set. b) Spatial distribution of macrophage-associated factors in human (hsNMF-F5) and mouse d21 (mmNMFd21-F8) tissue sections. The top 99th percentile of either factor was labelled as hsNMF-F5hi or mmNMFd21-F8hi and visualized together with the histopathological spot annotations grouped into ‘fibrotic / remodeled’ tissue (gray) and remaining tissue (light gray). Zoomed in graphs display factor activity overlaid the H&E images for selected regions that demonstrated high factor activity in areas of bronchial epithelium within fibrotic tissue. c) Top 15 contributing genes to mmNMFd21-F13, which was identified to contain a strong plasma cell profile driven by Igha, among other immunoglobulin-related genes. H&E, Hematoxylin and eosin.

