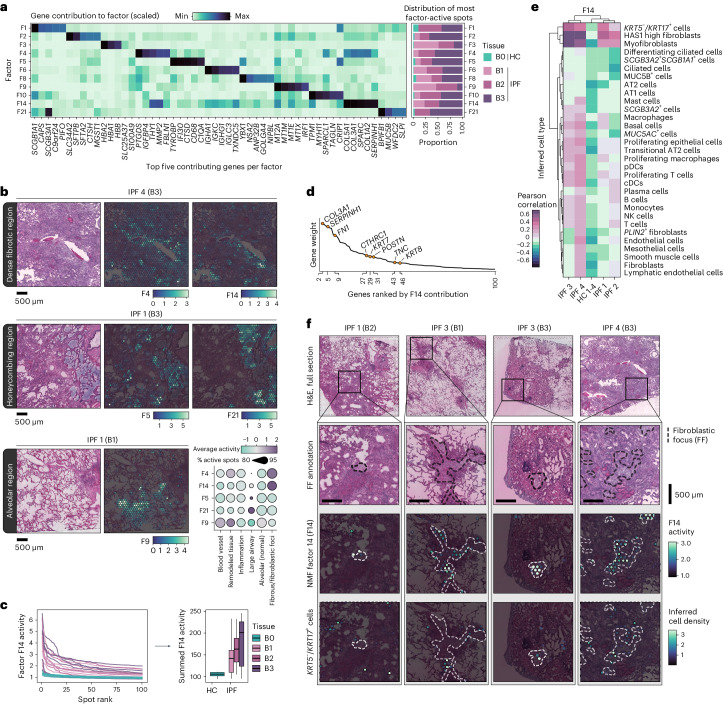
Fig. 2. Disease-associated signatures revealed by NMF.
a, NMF identified signatures over-represented in IPF tissue. Their relative contribution to each factor (scaled) is displayed for the top five contributing genes per factor, and the proportion of spots with the highest activity (99th percentile) by condition and tissue severity grade. b, Spatial representation of selected NMF factors across IPF lung sections, demonstrating distinct localization patterns that was observed across all IPF samples. F4 and F14 marked heavily fibrotic regions, F5 and F21 associated with honeycombing structures and F9 were seen in alveolar regions. The dot plot displays the average activity (scaled and centered) and detection rate (percentage of spots with increased activity) within the annotated histological regions across all tissue blocks. c, Activity profile of the top 100 ranked spots per sample based on F14 activity (line chart), highlighting a consistent distinction between HC and IPF tissue samples, further summarized by summing the F14 activity levels and grouped based on tissue remodeling extent (B0, n = 6; B1, n = 7; B2, n = 6; B3, n = 6) (box plot). The center line is the median, the box limits are the upper and lower quartiles and the whiskers are 1.5× interquartile range. d, Ranking of the top 100 genes for F14 based on gene weight (contribution) to the factor, with keratins, collagens and other fibrosis-related genes emphasized. e, Correlation heat map between F14 activity and densities of inferred cell types within spatial spots, capturing potential colocalization of F14 and cell types (strong correlation suggests spatial co-occurrence). f, Visualization of FF annotations, F14 activity and the distribution of inferred KRT5−/KRT17+ cells in selected samples and regions in all IPF donor lungs.

