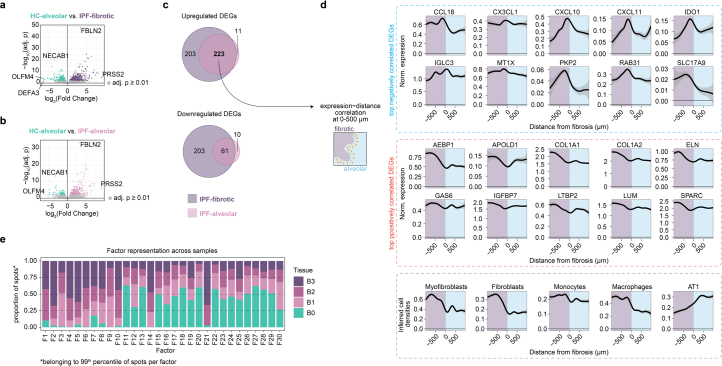
Extended Data Fig. 2. Differential gene expression in IPF and NMF factor distribution.
a) Differential gene expression between annotated fibrotic regions of IPF lungs and HC samples. b) Differential gene expression between annotated alveolar regions from IPF lungs and samples from healthy control (HC) lungs. c) Overlap of significantly (FDR-adjusted p-value < 0.01) upregulated (top) and downregulated (bottom) DEGs in IPF alveolar and fibrotic regions compared to HC. d) The spatial gene expression of the 223 overlapping upregulated DEGs were used to calculate correlation (Pearson) values from the fibrotic border distances using gene expression against the 0-500 µm distances. The gene expression for the top 10 significantly (Benjamini–Hochberg adj. p < 0.05) up and down correlated genes, as well as the inferred cell densities of selected cell types, were visualized for the 2000 µm distances centered around the fibrotic border using a generalized additive model (GAM) for the regression line. Gray areas correspond to 95% confidence intervals. e) NMF factorization was performed on all human Visium samples. Spots with the highest activity (99th percentile; Fhi) for each factor were identified and used to calculate the proportion of Fhi spots among all spots, grouped by tissue block grading (B0-B1) and displayed as a stacked bar chart. NMF, non-negative matrix factorization; DEG, differentially expressed gene; HC, healthy controls.

